Authors
Summary
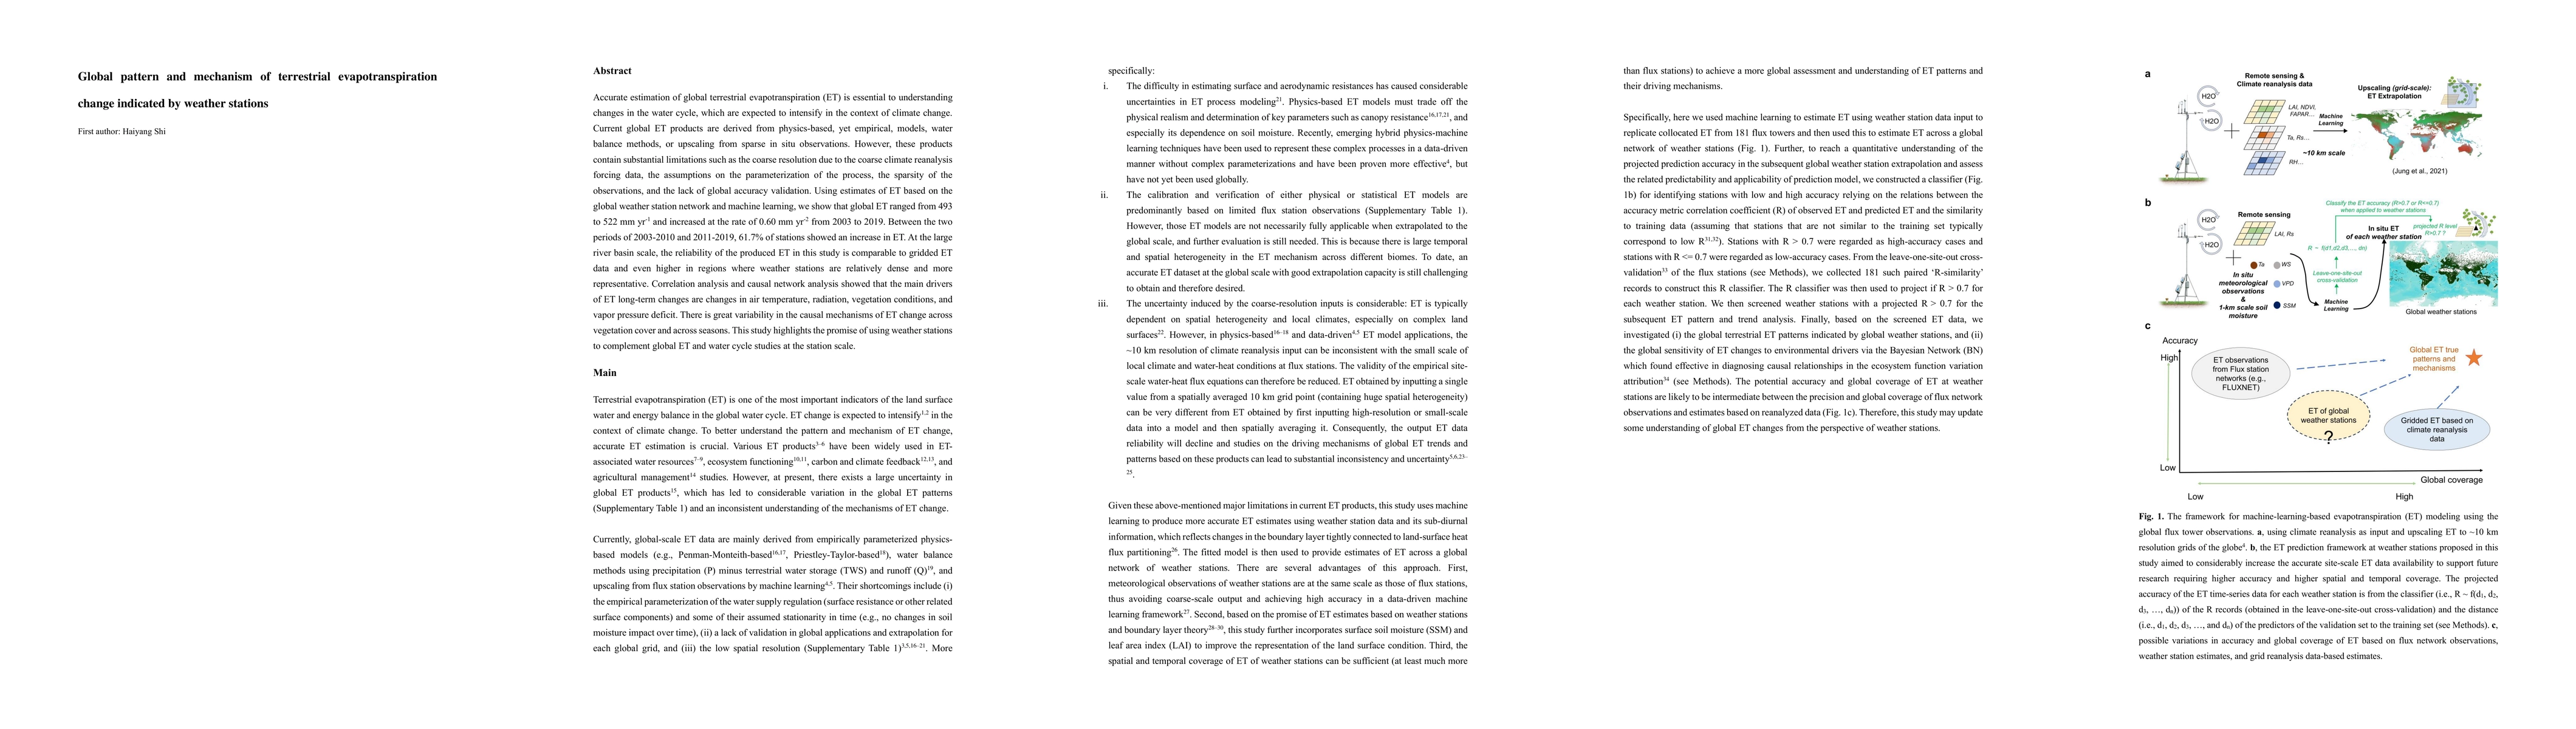
Accurate estimation of global terrestrial evapotranspiration (ET) is essential to understanding changes in the water cycle, which are expected to intensify in the context of climate change. Current global ET products are derived from physics-based, yet empirical, models, water balance methods, or upscaling from sparse in situ observations. However, these products contain substantial limitations such as the coarse resolution due to the coarse climate reanalysis forcing data, the assumptions on the parameterization of the process, the sparsity of the observations, and the lack of global accuracy validation. Using estimates of ET based on the global weather station network and machine learning, we show that global ET ranged from 493 to 522 mm yr-1 and increased at the rate of 0.60 mm yr-2 from 2003 to 2019. Between the two periods of 2003-2010 and 2011-2019, 61.7% of stations showed an increase in ET. At the large river basin scale, the reliability of the produced ET in this study is comparable to gridded ET data and even higher in regions where weather stations are relatively dense and more representative. Correlation analysis and causal network analysis showed that the main drivers of ET long-term changes are changes in air temperature, radiation, vegetation conditions, and vapor pressure deficit. There is great variability in the causal mechanisms of ET change across vegetation cover and across seasons. This study highlights the promise of using weather stations to complement global ET and water cycle studies at the station scale.
AI Key Findings
Generated Sep 03, 2025
Methodology
The study utilized weather station data and machine learning, specifically Random Forests, to estimate terrestrial evapotranspiration (ET) globally. The model was trained using data from the FLUXNET2015 dataset and remote sensing data, then applied to over 8000 Global Summary of the Day (GSOD) weather stations.
Key Results
- Global ET ranged from 493 to 522 mm yr-1 and increased at a rate of 0.60 mm yr-2 from 2003 to 2019.
- 61.7% of weather stations showed an increase in ET between 2003-2010 and 2011-2019.
- Temperature, radiation, vegetation conditions, and vapor pressure deficit were identified as the main drivers of ET long-term changes.
Significance
This research provides a more accurate and station-scale understanding of global ET patterns and dynamics, which is crucial for comprehending changes in the water cycle under climate change.
Technical Contribution
The application of machine learning techniques, specifically Random Forests, to weather station data for estimating global ET, reducing reliance on empirical parameterization and coarse climate reanalysis data.
Novelty
This study stands out by providing a data-driven, station-scale analysis of global ET, offering a more accurate representation of ET patterns and dynamics compared to existing gridded ET data products.
Limitations
- The study's reliability is limited by the density and representativeness of weather stations, particularly in regions like deserts and tropical rainforests.
- The analysis did not account for certain factors like land cover change, groundwater levels, and changes in agricultural practices that could influence ET.
Future Work
- Increasing weather station density in currently underrepresented regions could improve ET estimation accuracy.
- Incorporating additional variables and factors such as land cover change, nitrogen deposition, and changes in agricultural practices in future models.
Paper Details
PDF Preview
Key Terms
Citation Network
Current paper (gray), citations (green), references (blue)
Display is limited for performance on very large graphs.
Similar Papers
Found 4 papersImpact of Employing Weather Forecast Data as Input to the Estimation of Evapotranspiration by Deep Neural Network Models
Carlos Guerrero, Pedro J. Vaz, Gabriela Schütz et al.
Evaluation of forecasts by a global data-driven weather model with and without probabilistic post-processing at Norwegian stations
John Bjørnar Bremnes, Thomas N. Nipen, Ivar A. Seierstad
No citations found for this paper.
Comments (0)