Event2Graph: Event-driven Bipartite Graph for Multivariate Time-series Anomaly Detection
Publication
Metrics
AI Quick Summary
This paper proposes Event2Graph, a dynamic bipartite graph method for multivariate time-series anomaly detection. It models time-series as nodes and segments as events, allowing for flexible inter-dependency modeling and formulating anomaly detection as a self-supervised edge stream prediction problem in dynamic graphs. Experiments show the effectiveness of this approach.
Paper Preview
Abstract
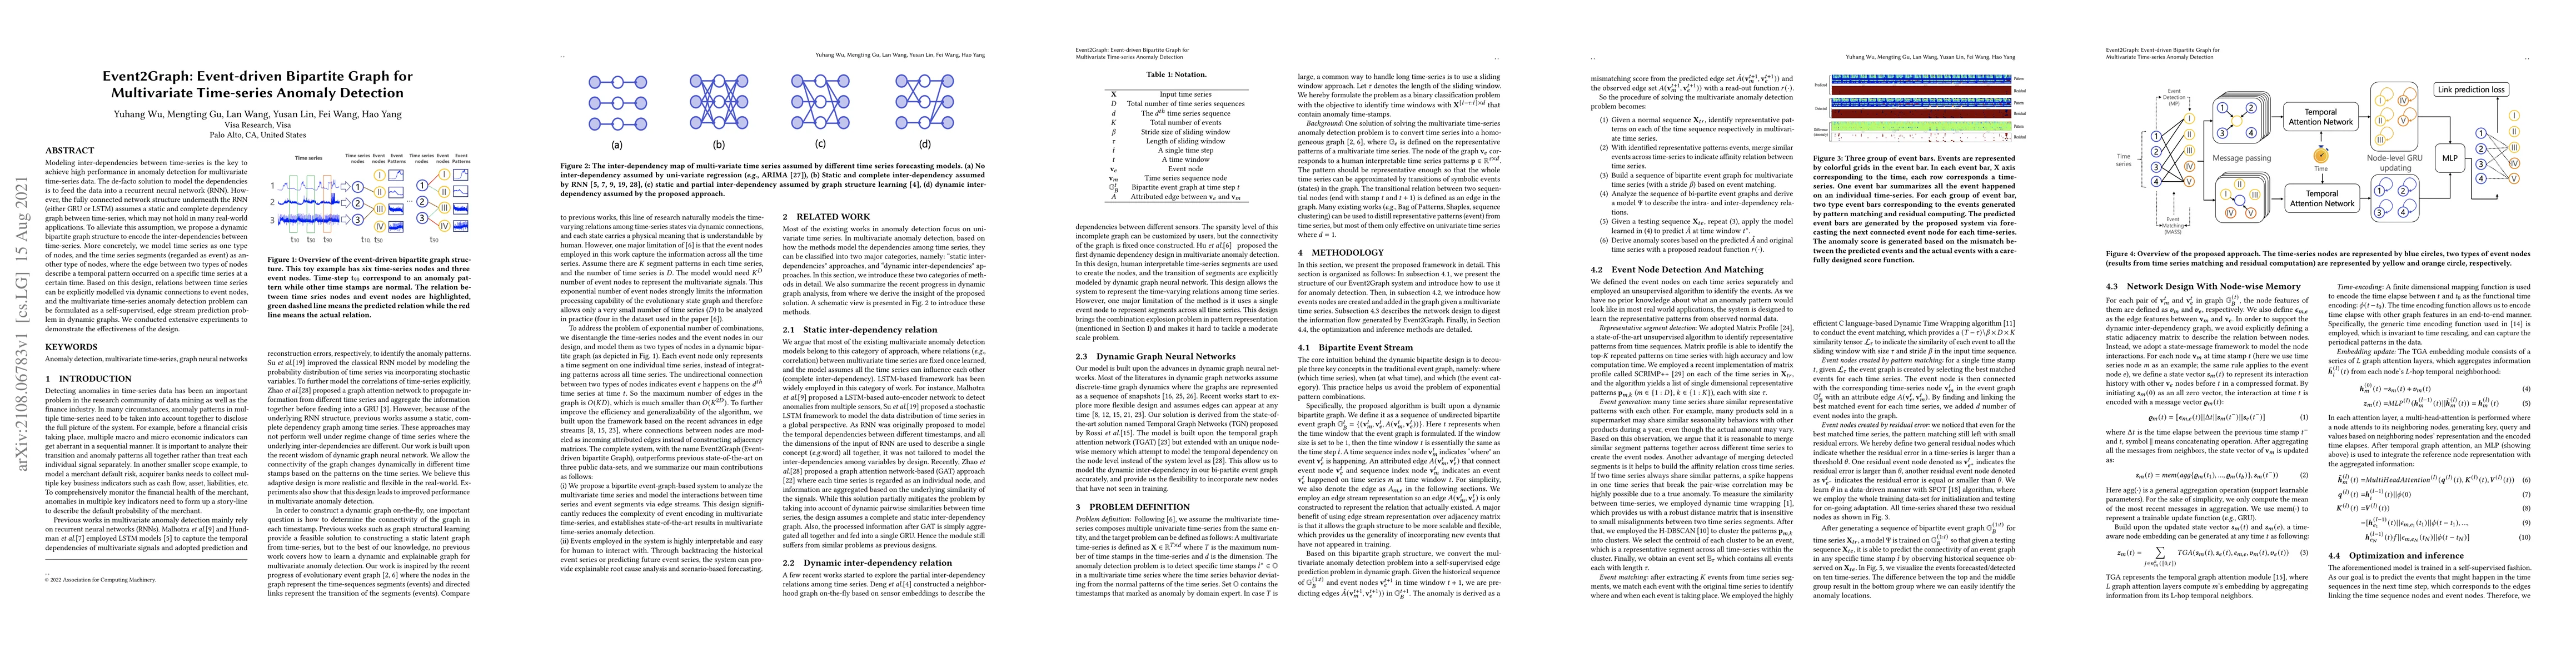
Modeling inter-dependencies between time-series is the key to achieve high performance in anomaly detection for multivariate time-series data. The de-facto solution to model the dependencies is to feed the data into a recurrent neural network (RNN). However, the fully connected network structure underneath the RNN (either GRU or LSTM) assumes a static and complete dependency graph between time-series, which may not hold in many real-world applications. To alleviate this assumption, we propose a dynamic bipartite graph structure to encode the inter-dependencies between time-series. More concretely, we model time series as one type of nodes, and the time series segments (regarded as event) as another type of nodes, where the edge between two types of nodes describe a temporal pattern occurred on a specific time series at a certain time. Based on this design, relations between time series can be explicitly modelled via dynamic connections to event nodes, and the multivariate time-series anomaly detection problem can be formulated as a self-supervised, edge stream prediction problem in dynamic graphs. We conducted extensive experiments to demonstrate the effectiveness of the design.
AI Key Findings
Get AI-generated insights about this paper's methodology, results, significance, and more — seven facets brought into focus.
Impact
Paper Details
Authors
PDF Preview
Key Terms
Citation Network
Current paper (gray), citations (green), references (blue)
Display is limited for performance on very large graphs.
Discussion 0