Publication
Metrics
AI Quick Summary
This study analyzes fan loops from active region AR~11899 using data from IRIS, EIS, AIA, and HMI. Observations reveal constant pressure footpoints with electron densities of 10.1 cm$^{-3}$ at 5.15 log(T/K), and two temperature components at 4.95 and 5.95 log(T/K) at the footpoints, while higher loop regions are nearly isothermal at 5.95 log(T/K). Plasma redshifts indicate increasing downflow speeds with temperature, suggesting low frequency nanoflares or impulsive heating.
Paper Preview
Abstract
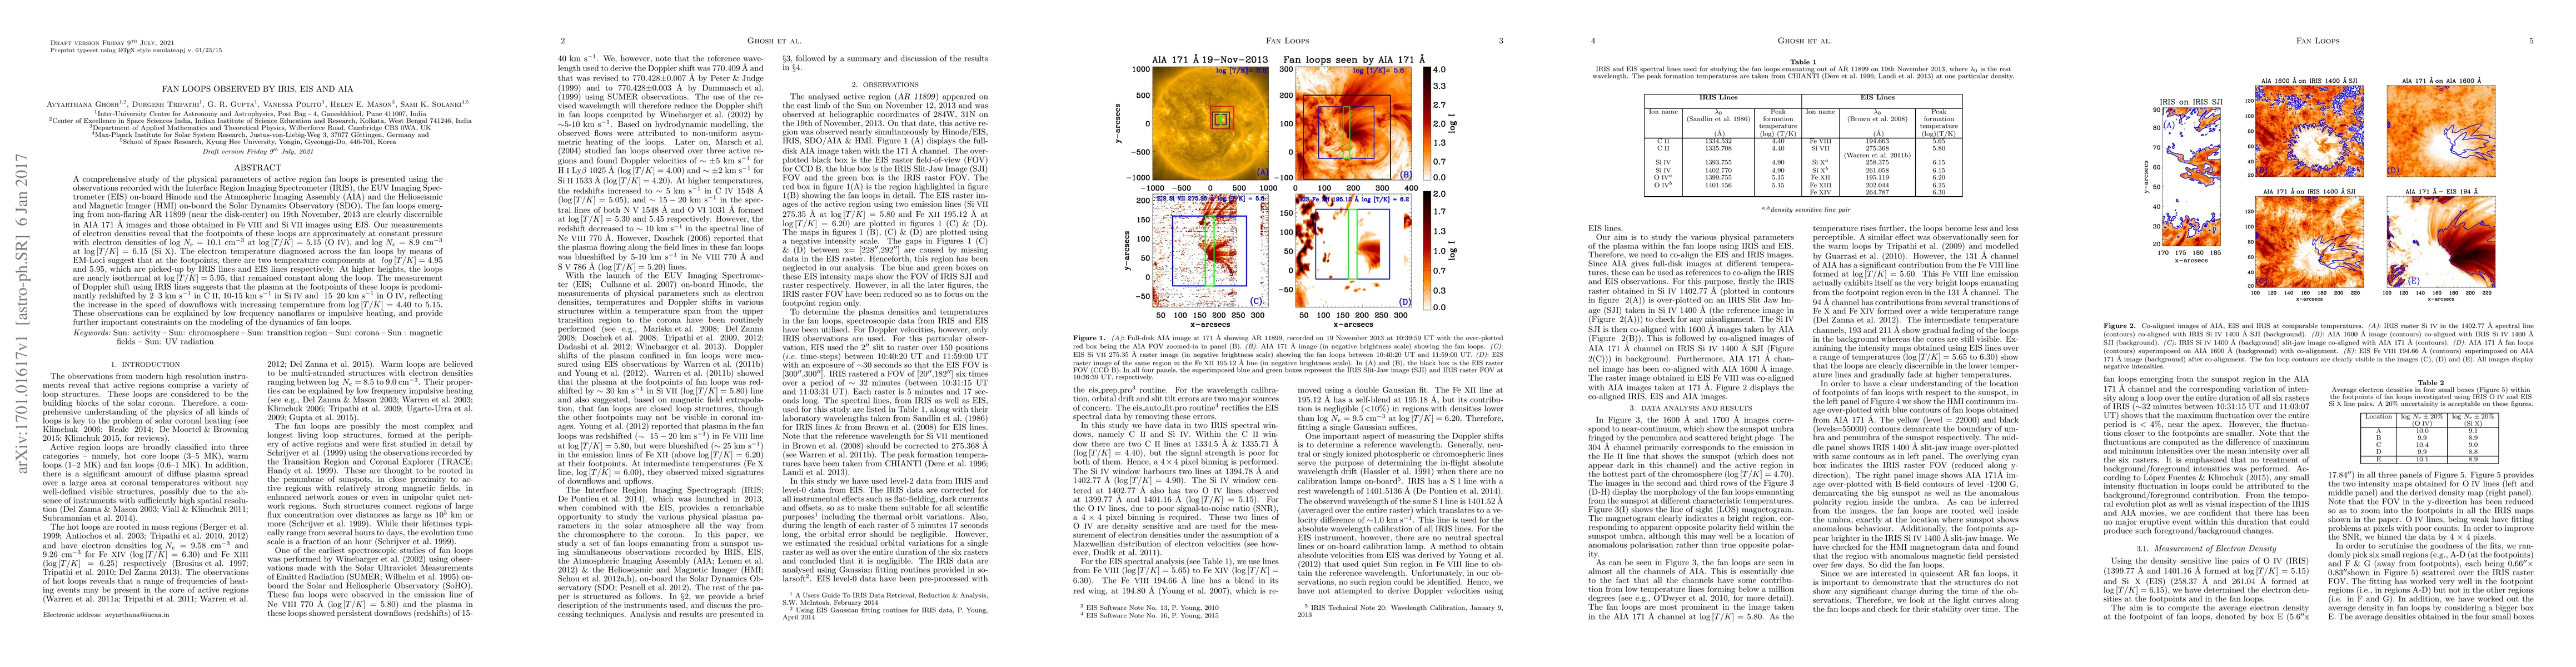
A comprehensive study of the physical parameters of active region fan loops is presented using the observations recorded with the Interface Region Imaging Spectrometer (IRIS), the EUV Imaging Spectrometer (EIS) on-board Hinode and the Atmospheric Imaging Assembly (AIA) and the Helioseismic and Magnetic Imager (HMI) on-board the Solar Dynamics Observatory (SDO). The fan loops emerging from non-flaring AR~11899 (near the disk-center) on 19th November, 2013 are clearly discernible in AIA 171~{\AA} images and those obtained in \ion{Fe}{8} and \ion{Si}{7} images using EIS. Our measurements of electron densities reveal that the footpoints of these loops are approximately at constant pressure with electron densities of $\log\,N_{e}=$ 10.1 cm$^{-3}$ at $\log\,[T/K]=5.15$ (\ion{O}{4}), and $\log\,N_{e}=$ 8.9 cm$^{-3}$ at $\log\,[T/K]=6.15$ (\ion{Si}{10}). The electron temperature diagnosed across the fan loops by means of EM-Loci suggest that at the footpoints, there are two temperature components at $\log\,[T/K]=4.95$ and 5.95, which are picked-up by IRIS lines and EIS lines respectively. At higher heights, the loops are nearly isothermal at $\log\,[T/K]=5.95$, that remained constant along the loop. The measurement of Doppler shift using IRIS lines suggests that the plasma at the footpoints of these loops is predominantly redshifted by 2-3~km~s$^{-1}$ in \ion{C}{2}, 10-15~km~s$^{-1}$ in \ion{Si}{4} and $~$15{--}20~km~s$^{-1}$ in \ion{O}{4}, reflecting the increase in the speed of downflows with increasing temperature from $\log\,[T/K]=4.40$ to 5.15. These observations can be explained by low frequency nanoflares or impulsive heating, and provide further important constraints on the modeling of the dynamics of fan loops.
AI Key Findings
Get AI-generated insights about this paper's methodology, results, significance, and more — seven facets brought into focus.
Impact
Paper Details
PDF Preview
Key Terms
Citation Network
Current paper (gray), citations (green), references (blue)
Display is limited for performance on very large graphs.
Discussion 0