Publication
Metrics
AI Quick Summary
This study examines the heating and dynamics of two distinct flare loop systems in a C4.7 solar flare on February 13, 2011, using AIA and EIS observations. The loops show different evolution patterns, with the second set exhibiting continuous heating and prolonged blueshifts, suggesting ongoing heating. The EBTEL model accurately simulates the first set but struggles with the second set's prolonged blueshifts and low-temperature discrepancies.
Paper Preview
Abstract
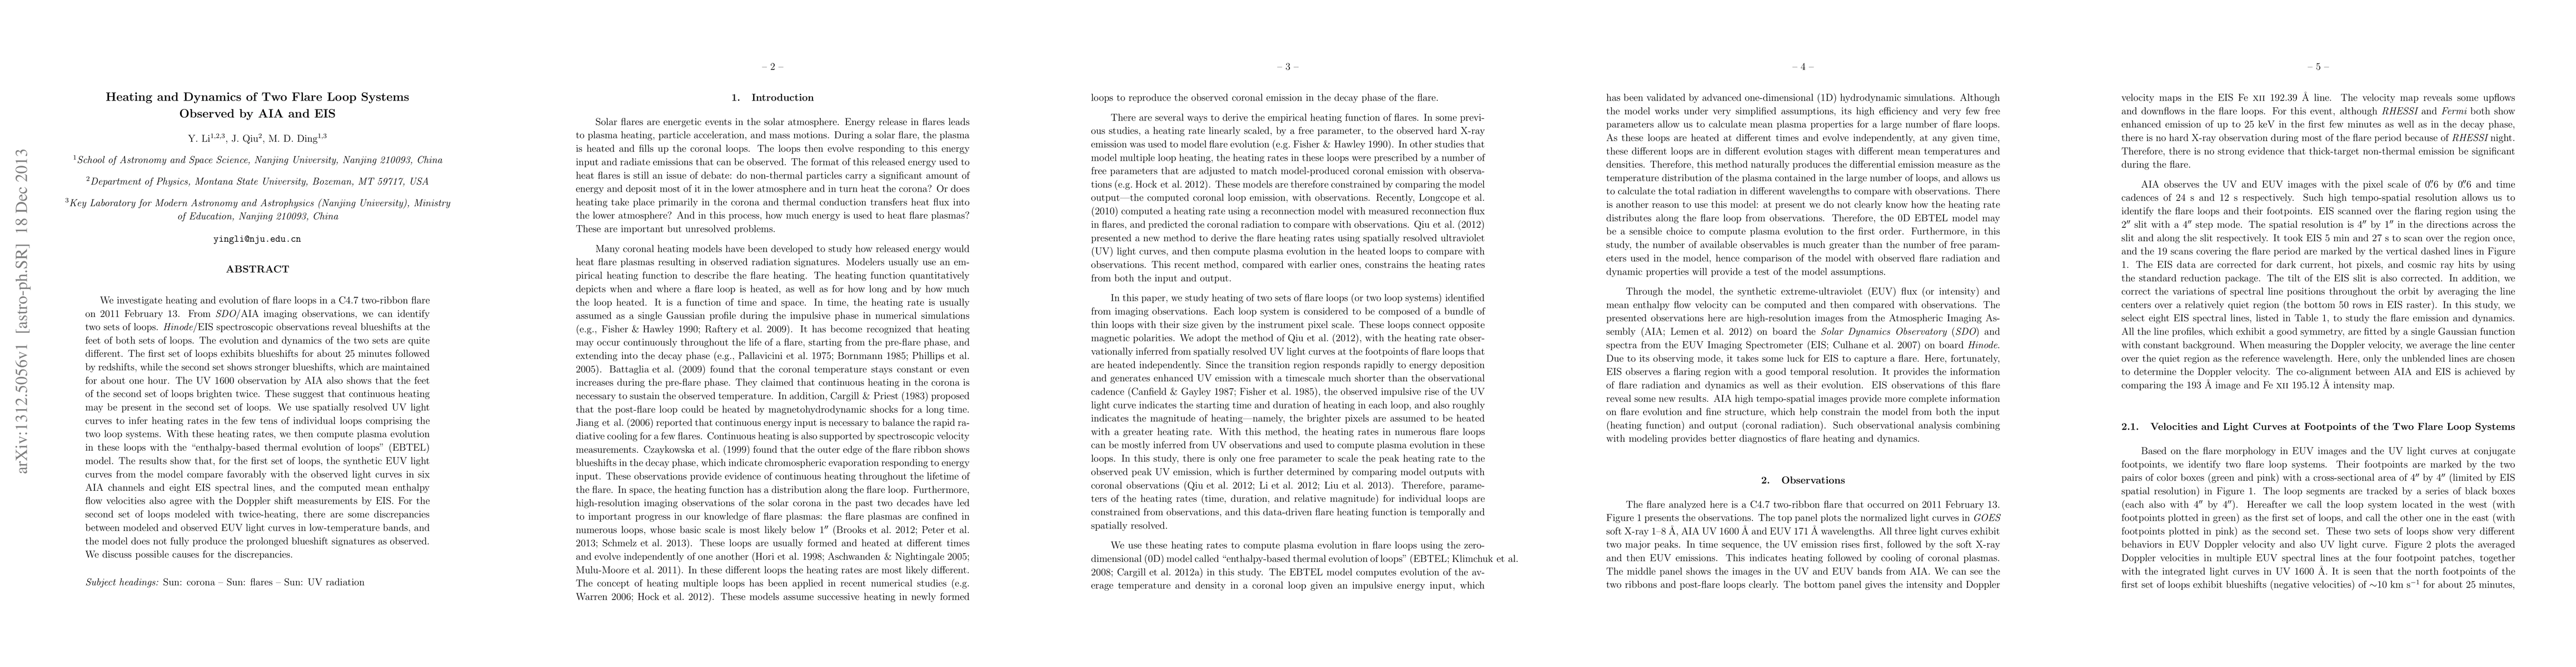
We investigate heating and evolution of flare loops in a C4.7 two-ribbon flare on 2011 February 13. From SDO/AIA imaging observations, we can identify two sets of loops. Hinode/EIS spectroscopic observations reveal blueshifts at the feet of both sets of loops. The evolution and dynamics of the two sets are quite different. The first set of loops exhibits blueshifts for about 25 minutes followed by redshifts, while the second set shows stronger blueshifts, which are maintained for about one hour. The UV 1600 observation by AIA also shows that the feet of the second set of loops brighten twice. These suggest that continuous heating may be present in the second set of loops. We use spatially resolved UV light curves to infer heating rates in the few tens of individual loops comprising the two loop systems. With these heating rates, we then compute plasma evolution in these loops with the "enthalpy-based thermal evolution of loops" (EBTEL) model. The results show that, for the first set of loops, the synthetic EUV light curves from the model compare favorably with the observed light curves in six AIA channels and eight EIS spectral lines, and the computed mean enthalpy flow velocities also agree with the Doppler shift measurements by EIS. For the second set of loops modeled with twice-heating, there are some discrepancies between modeled and observed EUV light curves in low-temperature bands, and the model does not fully produce the prolonged blueshift signatures as observed. We discuss possible causes for the discrepancies.
AI Key Findings
Get AI-generated insights about this paper's methodology, results, significance, and more — seven facets brought into focus.
Impact
Paper Details
PDF Preview
Key Terms
Citation Network
Current paper (gray), citations (green), references (blue)
Display is limited for performance on very large graphs.
Discussion 0