Fast Segmentation of Left Ventricle in CT Images by Explicit Shape Regression using Random Pixel Difference Features
Publication
Metrics
AI Quick Summary
This paper proposes a fast segmentation algorithm for left ventricles in CT images using explicit shape regression with random pixel difference features, achieving an average running time of 1.2 milliseconds per case and maintaining high accuracy with a segmentation error of 1.21 ± 0.11 mm for endocardium and 1.23 ± 0.11 mm for epicardium.
Paper Preview
Abstract
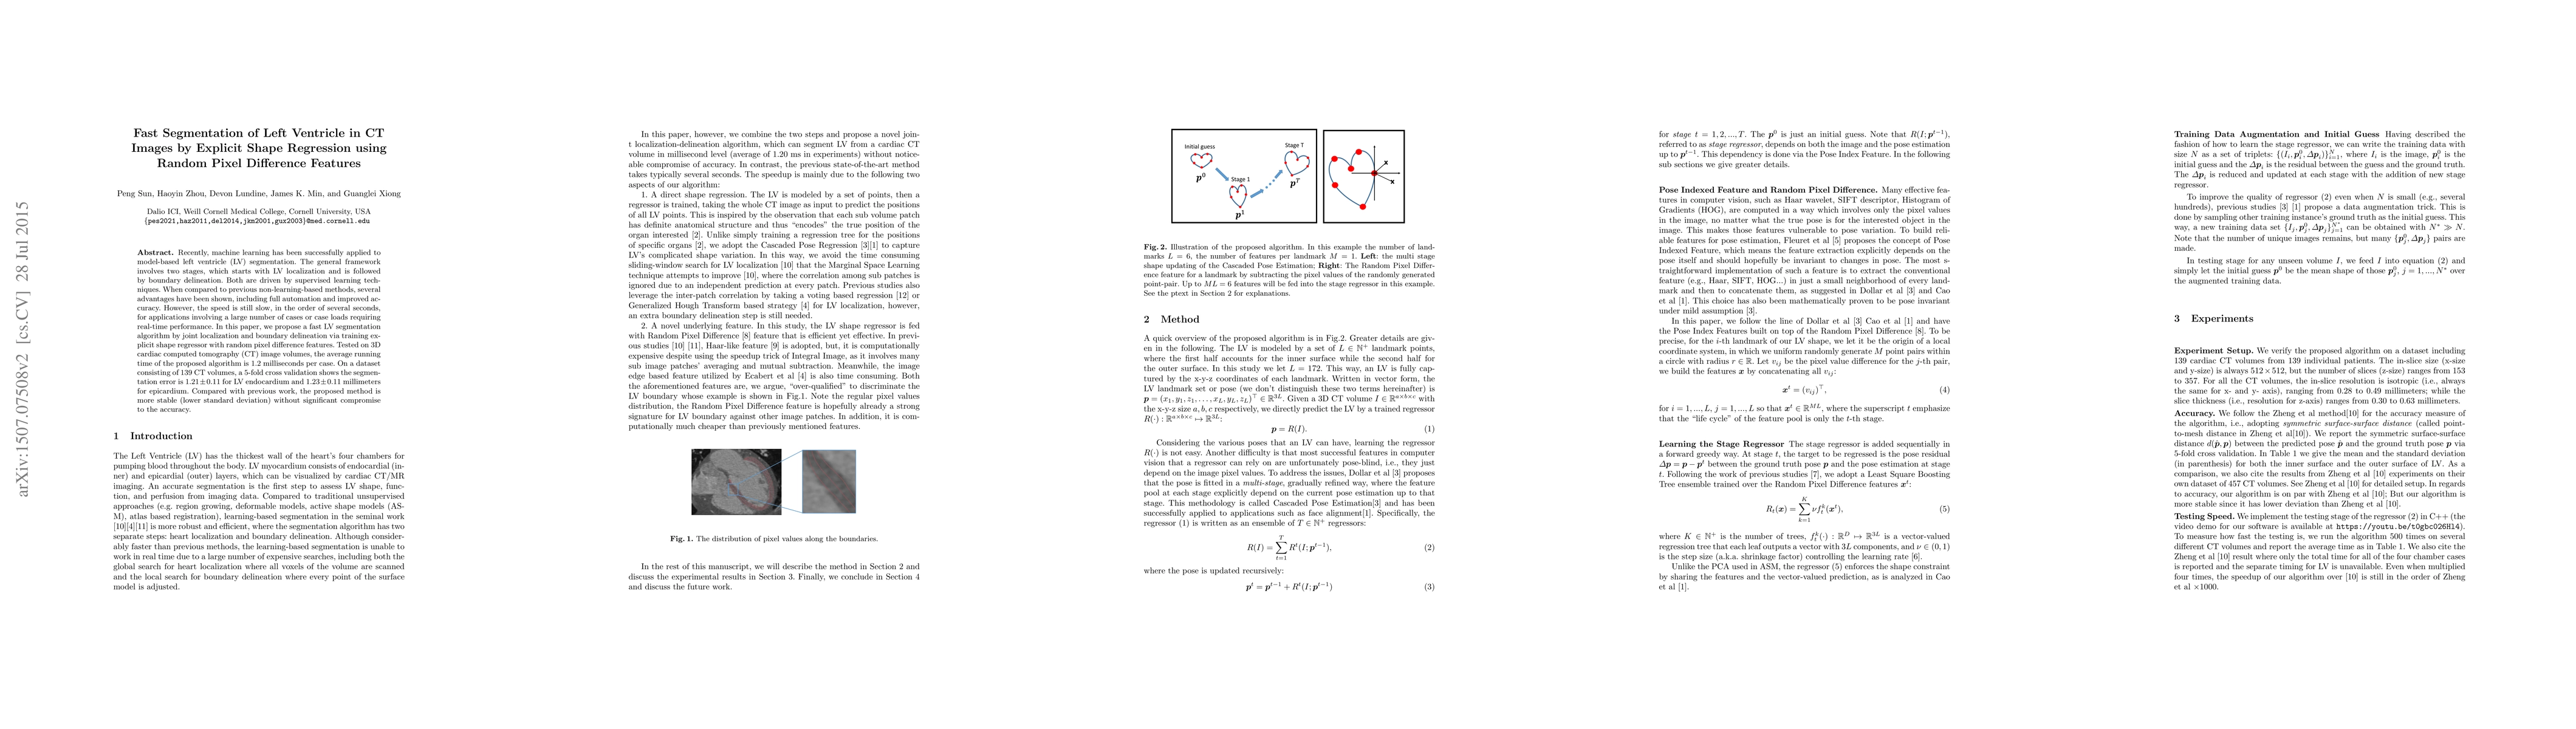
Recently, machine learning has been successfully applied to model-based left ventricle (LV) segmentation. The general framework involves two stages, which starts with LV localization and is followed by boundary delineation. Both are driven by supervised learning techniques. When compared to previous non-learning-based methods, several advantages have been shown, including full automation and improved accuracy. However, the speed is still slow, in the order of several seconds, for applications involving a large number of cases or case loads requiring real-time performance. In this paper, we propose a fast LV segmentation algorithm by joint localization and boundary delineation via training explicit shape regressor with random pixel difference features. Tested on 3D cardiac computed tomography (CT) image volumes, the average running time of the proposed algorithm is 1.2 milliseconds per case. On a dataset consisting of 139 CT volumes, a 5-fold cross validation shows the segmentation error is $1.21 \pm 0.11$ for LV endocardium and $1.23 \pm 0.11$ millimeters for epicardium. Compared with previous work, the proposed method is more stable (lower standard deviation) without significant compromise to the accuracy.
AI Key Findings
Get AI-generated insights about this paper's methodology, results, significance, and more — seven facets brought into focus.
Impact
Paper Details
PDF Preview
Key Terms
Citation Network
Current paper (gray), citations (green), references (blue)
Display is limited for performance on very large graphs.
Discussion 0