FAVis: Visual Analytics of Factor Analysis for Psychological Research
Publication
Metrics
AI Quick Summary
FAVis is an interactive visualization tool designed to assist psychological researchers in interpreting factor analysis results, featuring multiple views for visualizing factor loadings and correlations. It enables users to set optimal thresholds for clarity and retain crucial information, alongside tagging variables to better understand associated psychological constructs.
Paper Preview
Abstract
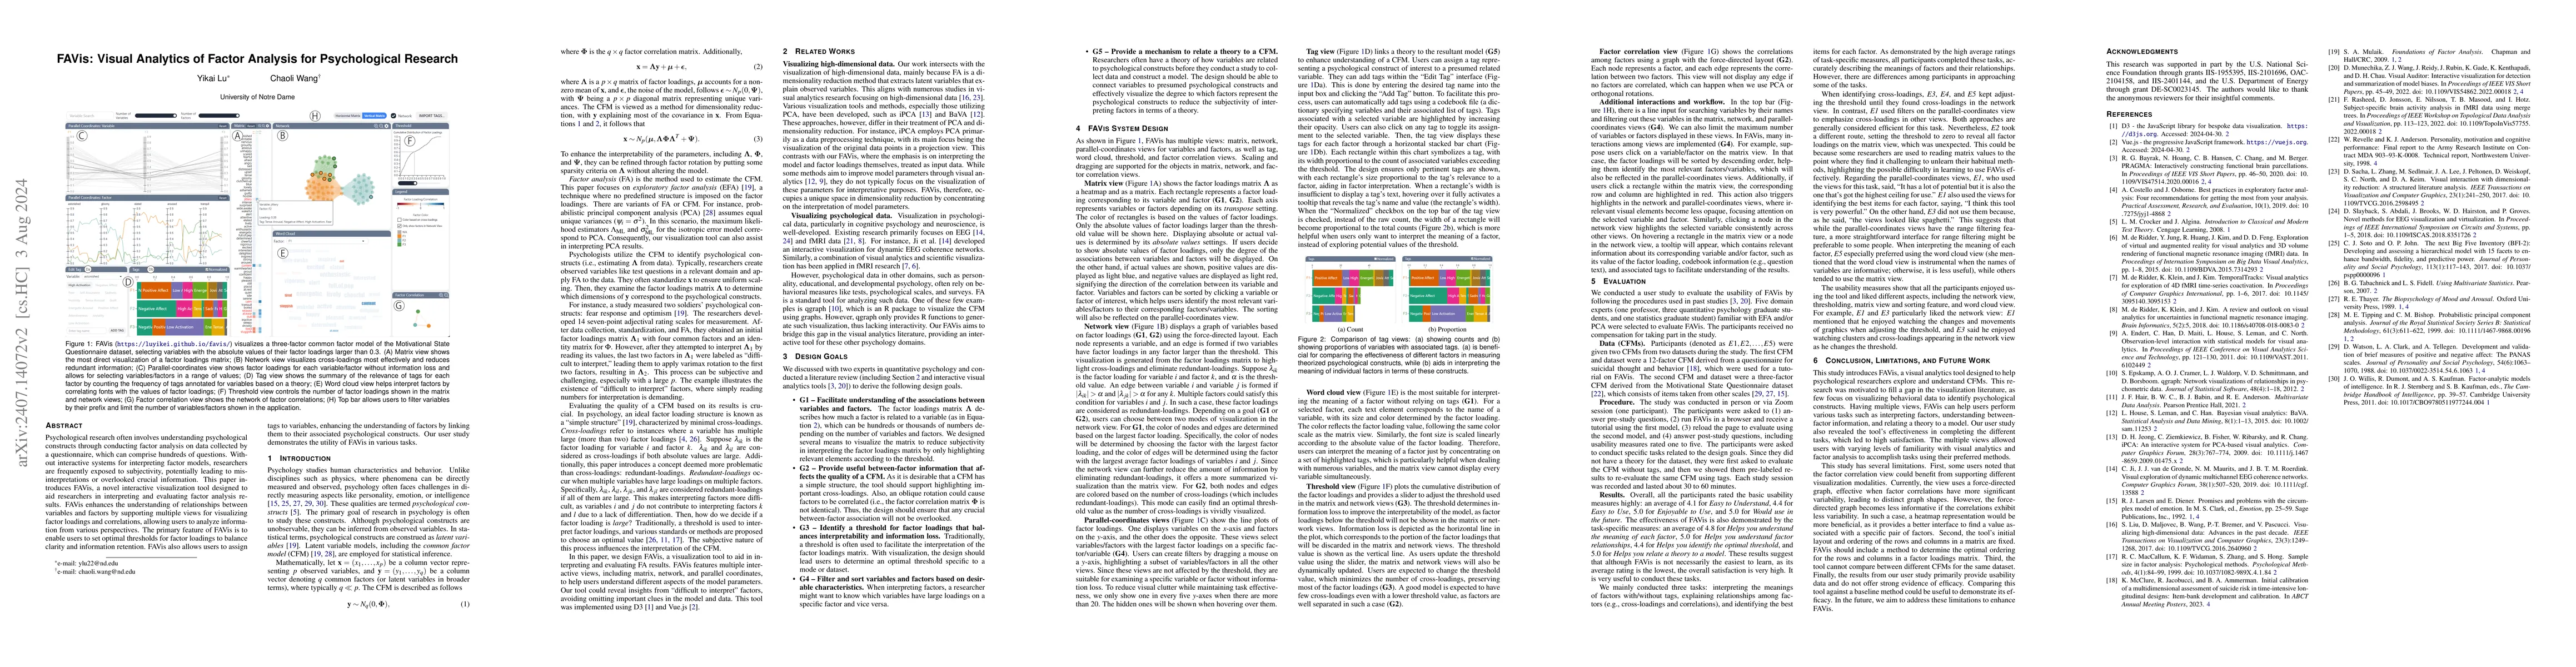
Psychological research often involves understanding psychological constructs through conducting factor analysis on data collected by a questionnaire, which can comprise hundreds of questions. Without interactive systems for interpreting factor models, researchers are frequently exposed to subjectivity, potentially leading to misinterpretations or overlooked crucial information. This paper introduces FAVis, a novel interactive visualization tool designed to aid researchers in interpreting and evaluating factor analysis results. FAVis enhances the understanding of relationships between variables and factors by supporting multiple views for visualizing factor loadings and correlations, allowing users to analyze information from various perspectives. The primary feature of FAVis is to enable users to set optimal thresholds for factor loadings to balance clarity and information retention. FAVis also allows users to assign tags to variables, enhancing the understanding of factors by linking them to their associated psychological constructs. Our user study demonstrates the utility of FAVis in various tasks.
AI Key Findings
Get AI-generated insights about this paper's methodology, results, significance, and more — seven facets brought into focus.
Impact
Paper Details
Authors
PDF Preview
Citation Network
Current paper (gray), citations (green), references (blue)
Display is limited for performance on very large graphs.
Discussion 0