Filtergraph: A Flexible Web Application for Instant Data Visualization of Astronomy Datasets
Publication
Metrics
AI Quick Summary
Filtergraph is a web application developed by Vanderbilt's VIDA for flexible, real-time visualization of diverse astronomy datasets, offering instant interactive data portals with scatter plots, histograms, and tables. It is optimized for speed, rendering large datasets efficiently, and is freely available at http://filtergraph.vanderbilt.edu/.
Paper Preview
Abstract
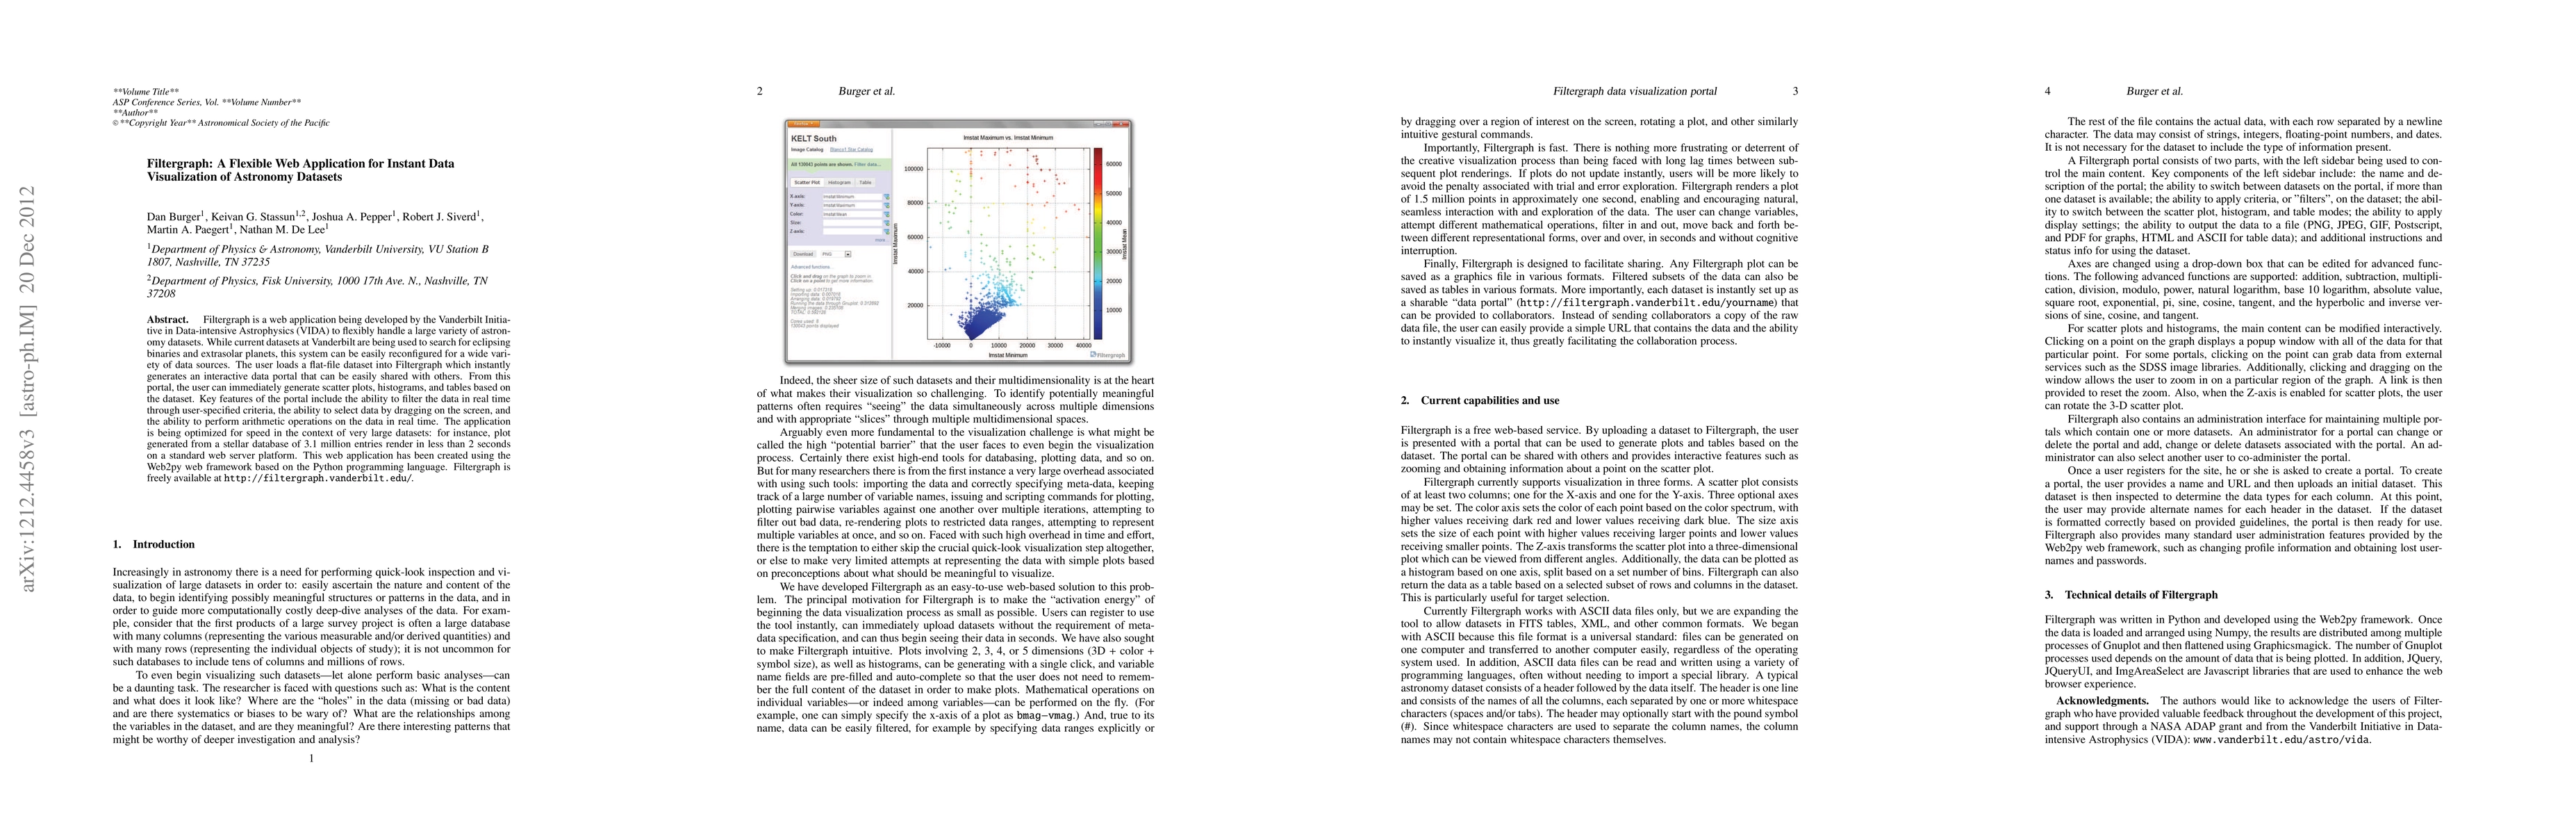
Filtergraph is a web application being developed by the Vanderbilt Initiative in Data-intensive Astrophysics (VIDA) to flexibly handle a large variety of astronomy datasets. While current datasets at Vanderbilt are being used to search for eclipsing binaries and extrasolar planets, this system can be easily reconfigured for a wide variety of data sources. The user loads a flat-file dataset into Filtergraph which instantly generates an interactive data portal that can be easily shared with others. From this portal, the user can immediately generate scatter plots, histograms, and tables based on the dataset. Key features of the portal include the ability to filter the data in real time through user-specified criteria, the ability to select data by dragging on the screen, and the ability to perform arithmetic operations on the data in real time. The application is being optimized for speed in the context of very large datasets: for instance, plot generated from a stellar database of 3.1 million entries render in less than 2 seconds on a standard web server platform. This web application has been created using the Web2py web framework based on the Python programming language. Filtergraph is freely available at http://filtergraph.vanderbilt.edu/.
AI Key Findings
Get AI-generated insights about this paper's methodology, results, significance, and more — seven facets brought into focus.
Paper Details
PDF Preview
Key Terms
Related Papers
No references found for this paper.
Discussion 0