Filtergraph: An Interactive Web Application for Visualization of Astronomy Datasets
Publication
Metrics
AI Quick Summary
Filtergraph is a web application for visualizing diverse astronomy datasets, offering interactive data portals with scatter plots, histograms, and tables, and real-time filtering and arithmetic operations. Optimized for large datasets, it renders visualizations quickly and is freely available at http://filtergraph.vanderbilt.edu/.
Paper Preview
Abstract
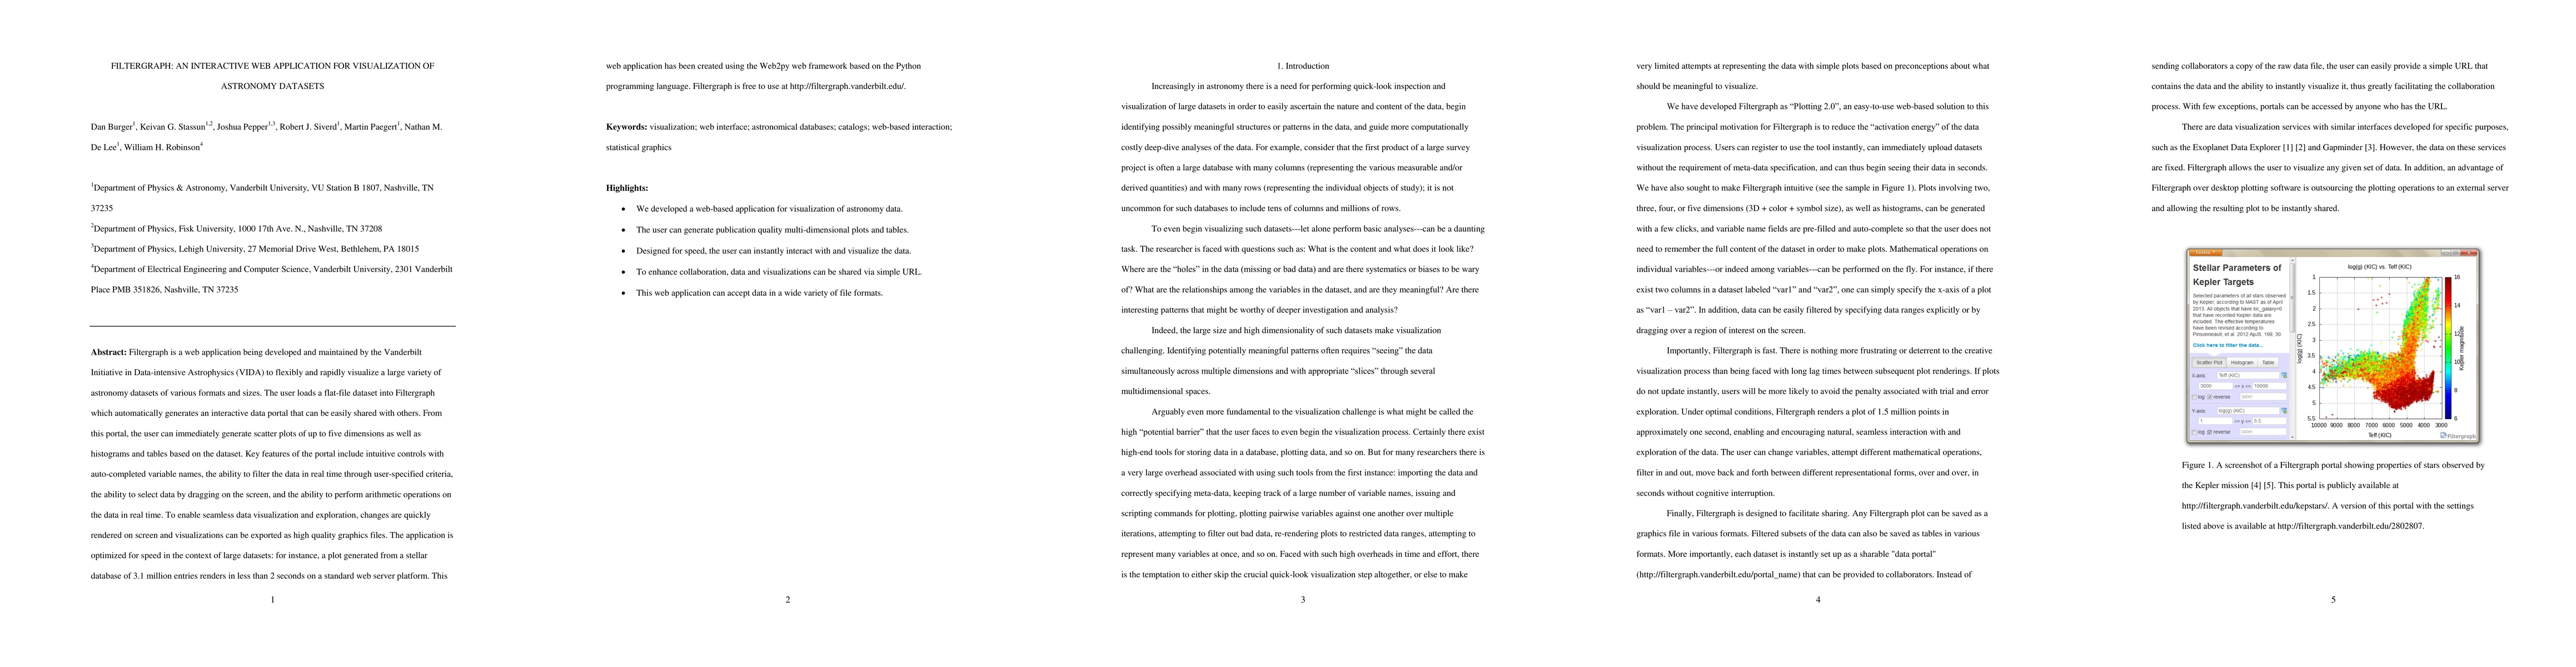
Filtergraph is a web application being developed and maintained by the Vanderbilt Initiative in Data-intensive Astrophysics (VIDA) to flexibly and rapidly visualize a large variety of astronomy datasets of various formats and sizes. The user loads a flat-file dataset into Filtergraph which automatically generates an interactive data portal that can be easily shared with others. From this portal, the user can immediately generate scatter plots of up to 5 dimensions as well as histograms and tables based on the dataset. Key features of the portal include intuitive controls with auto-completed variable names, the ability to filter the data in real time through user-specified criteria, the ability to select data by dragging on the screen, and the ability to perform arithmetic operations on the data in real time. To enable seamless data visualization and exploration, changes are quickly rendered on screen and visualizations can be exported as high quality graphics files. The application is optimized for speed in the context of large datasets: for instance, a plot generated from a stellar database of 3.1 million entries renders in less than 2 seconds on a standard web server platform. This web application has been created using the Web2py web framework based on the Python programming language. Filtergraph is free to use at http://filtergraph.vanderbilt.edu/.
AI Key Findings
Get AI-generated insights about this paper's methodology, results, significance, and more — seven facets brought into focus.
Impact
Paper Details
PDF Preview
Key Terms
Citation Network
Current paper (gray), citations (green), references (blue)
Display is limited for performance on very large graphs.
Discussion 0