Publication
Metrics
AI Quick Summary
This paper proposes a lattice gas model to study financial markets, likening the behavior of asset shares to gas molecules on a hidden social network of investors. The model's critical temperature and universal critical exponents suggest parallels to the phase transition between water and steam, predicting market auto-correlations and Hurst exponents.
Paper Preview
Abstract
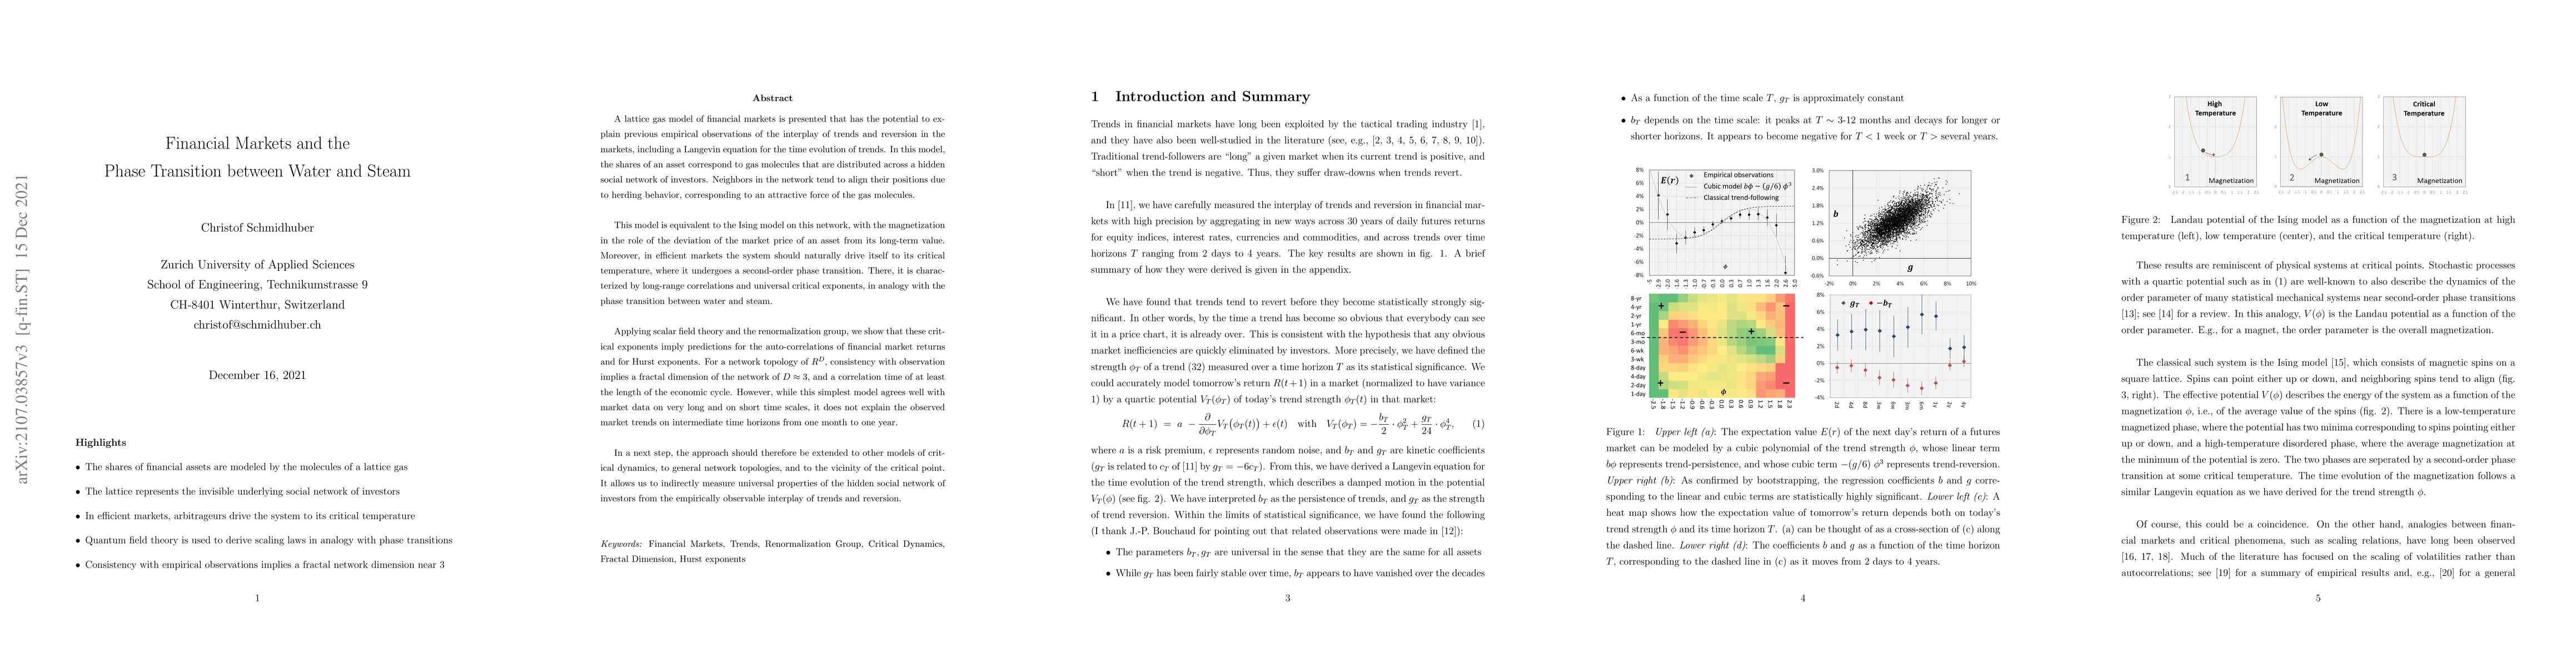
Motivated by empirical observations on the interplay of trends and reversion, a lattice gas model of financial markets is presented. The shares of an asset are modeled by gas molecules that are distributed across a hidden social network of investors. The model is equivalent to the Ising model on this network, whose magnetization represents the deviation of the asset price from its value. Moreover, the system should drive itself to its critical temperature in efficient markets. There, it is characterized by universal critical exponents, in analogy with the second-order phase transition between water and steam. These critical exponents imply predictions for the auto-correlations of financial market returns and for Hurst exponents. For a simple network topology, consistency with empirical observations implies a fractal network dimension near 3, and a correlation time at least as long as the economic cyle. To also explain the observed market auto-correlations at intermediate scales, the model should be extended beyond the critical domain, to other network topologies, and to other models of critical dynamics.
AI Key Findings
Get AI-generated insights about this paper's methodology, results, significance, and more — seven facets brought into focus.
Impact
Paper Details
Authors
PDF Preview
Key Terms
Citation Network
Current paper (gray), citations (green), references (blue)
Display is limited for performance on very large graphs.
Discussion 0