Firefly: a browser-based interactive 3D data visualization tool for millions of data points
Publication
Metrics
AI Quick Summary
Firefly is a browser-based interactive 3D visualization tool that can render and interact with over 10 million particles in real-time, and supports datasets with billions of particles using a custom-built octree render engine. It is accessible on most devices without installation and offers customizable interfaces for diverse audiences.
Paper Preview
Abstract
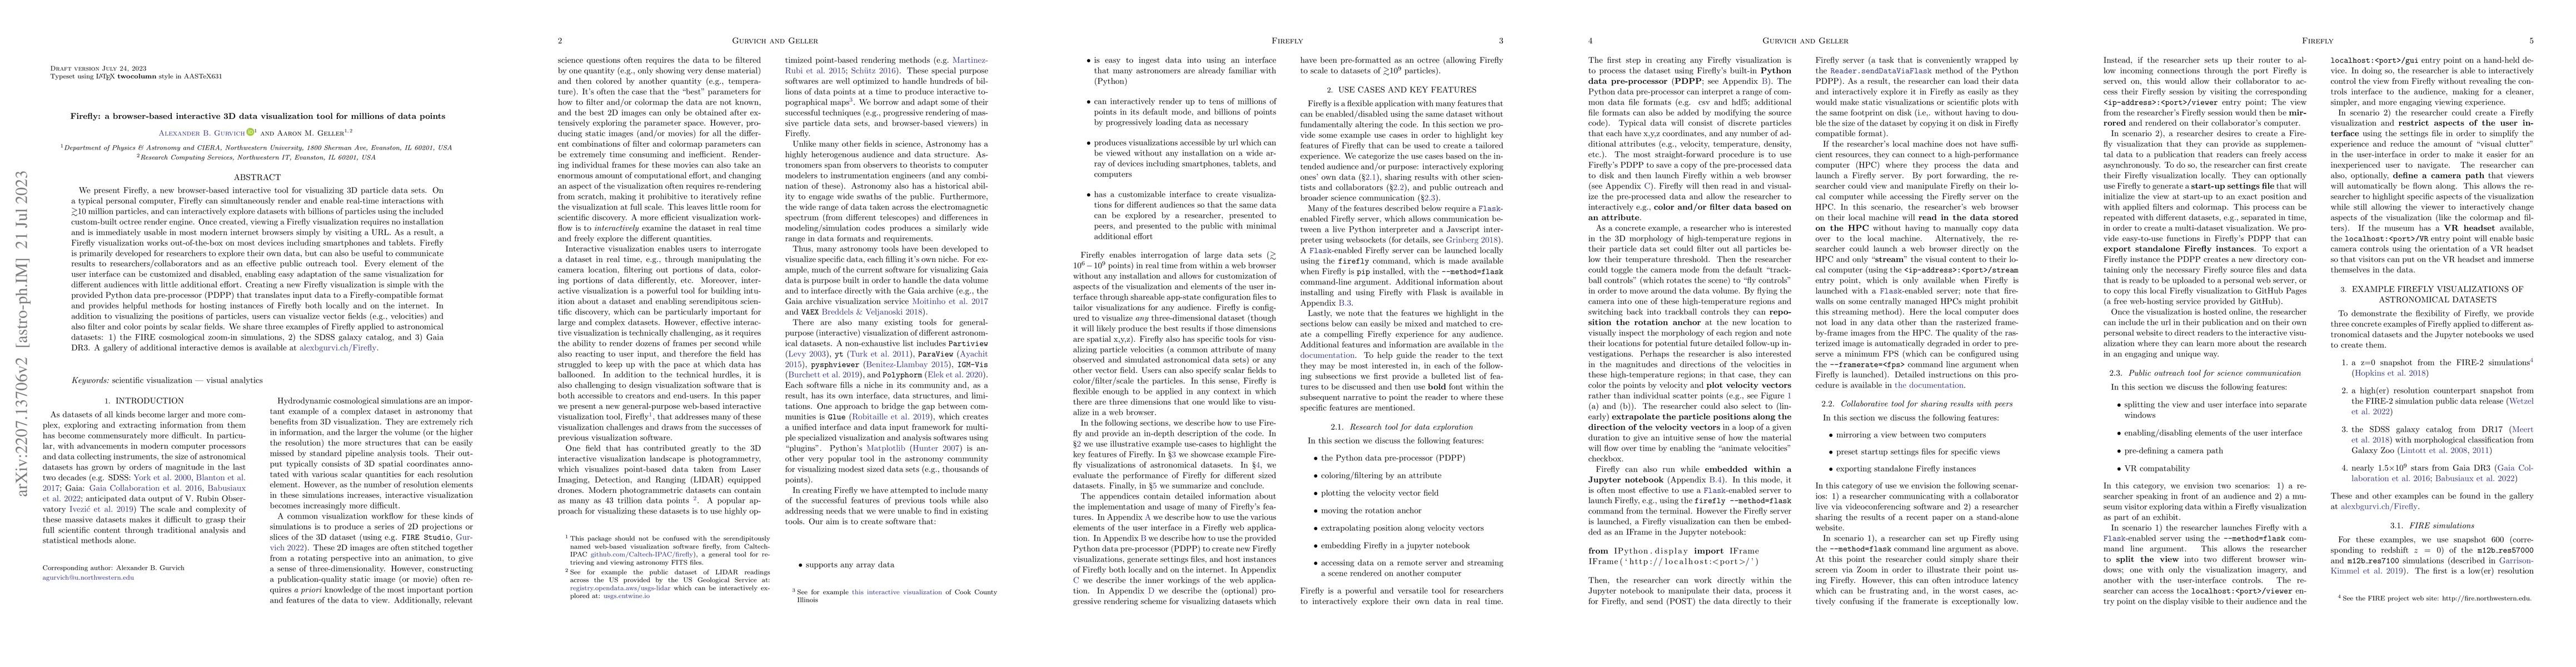
We present Firefly, a new browser-based interactive tool for visualizing 3D particle data sets. On a typical personal computer, Firefly can simultaneously render and enable real-time interactions with > ~10 million particles, and can interactively explore datasets with billions of particles using the included custom-built octree render engine. Once created, viewing a Firefly visualization requires no installation and is immediately usable in most modern internet browsers simply by visiting a URL. As a result, a Firefly visualization works out-of-the-box on most devices including smartphones and tablets. Firefly is primarily developed for researchers to explore their own data, but can also be useful to communicate results to researchers/collaborators and as an effective public outreach tool. Every element of the user interface can be customized and disabled, enabling easy adaptation of the same visualization for different audiences with little additional effort. Creating a new Firefly visualization is simple with the provided Python data pre-processor (PDPP) that translates input data to a Firefly-compatible format and provides helpful methods for hosting instances of Firefly both locally and on the internet. In addition to visualizing the positions of particles, users can visualize vector fields (e.g., velocities) and also filter and color points by scalar fields. We share three examples of Firefly applied to astronomical datasets: 1) the FIRE cosmological zoom-in simulations, 2) the SDSS galaxy catalog, and 3) Gaia DR3. A gallery of additional interactive demos is available at https://alexbgurvi.ch/Firefly.
AI Key Findings
Get AI-generated insights about this paper's methodology, results, significance, and more — seven facets brought into focus.
Impact
Paper Details
Authors
PDF Preview
Key Terms
Citation Network
Current paper (gray), citations (green), references (blue)
Display is limited for performance on very large graphs.
Discussion 0