Publication
Metrics
AI Quick Summary
This paper presents the EoR power spectrum analysis from nearly 40 hours of data collected by the MWA Phase II at redshifts 6.5, 6.8, and 7.1, employing improved calibration and data quality techniques. The study achieves the lowest power spectrum limit of $\Delta^2\leqslant2.39\times 10^3$ $\mathrm{mK}^2$ at $k=0.59$ $h$ $\mathrm{Mpc^{-1}}$ and $z=6.5$.
Paper Preview
Abstract
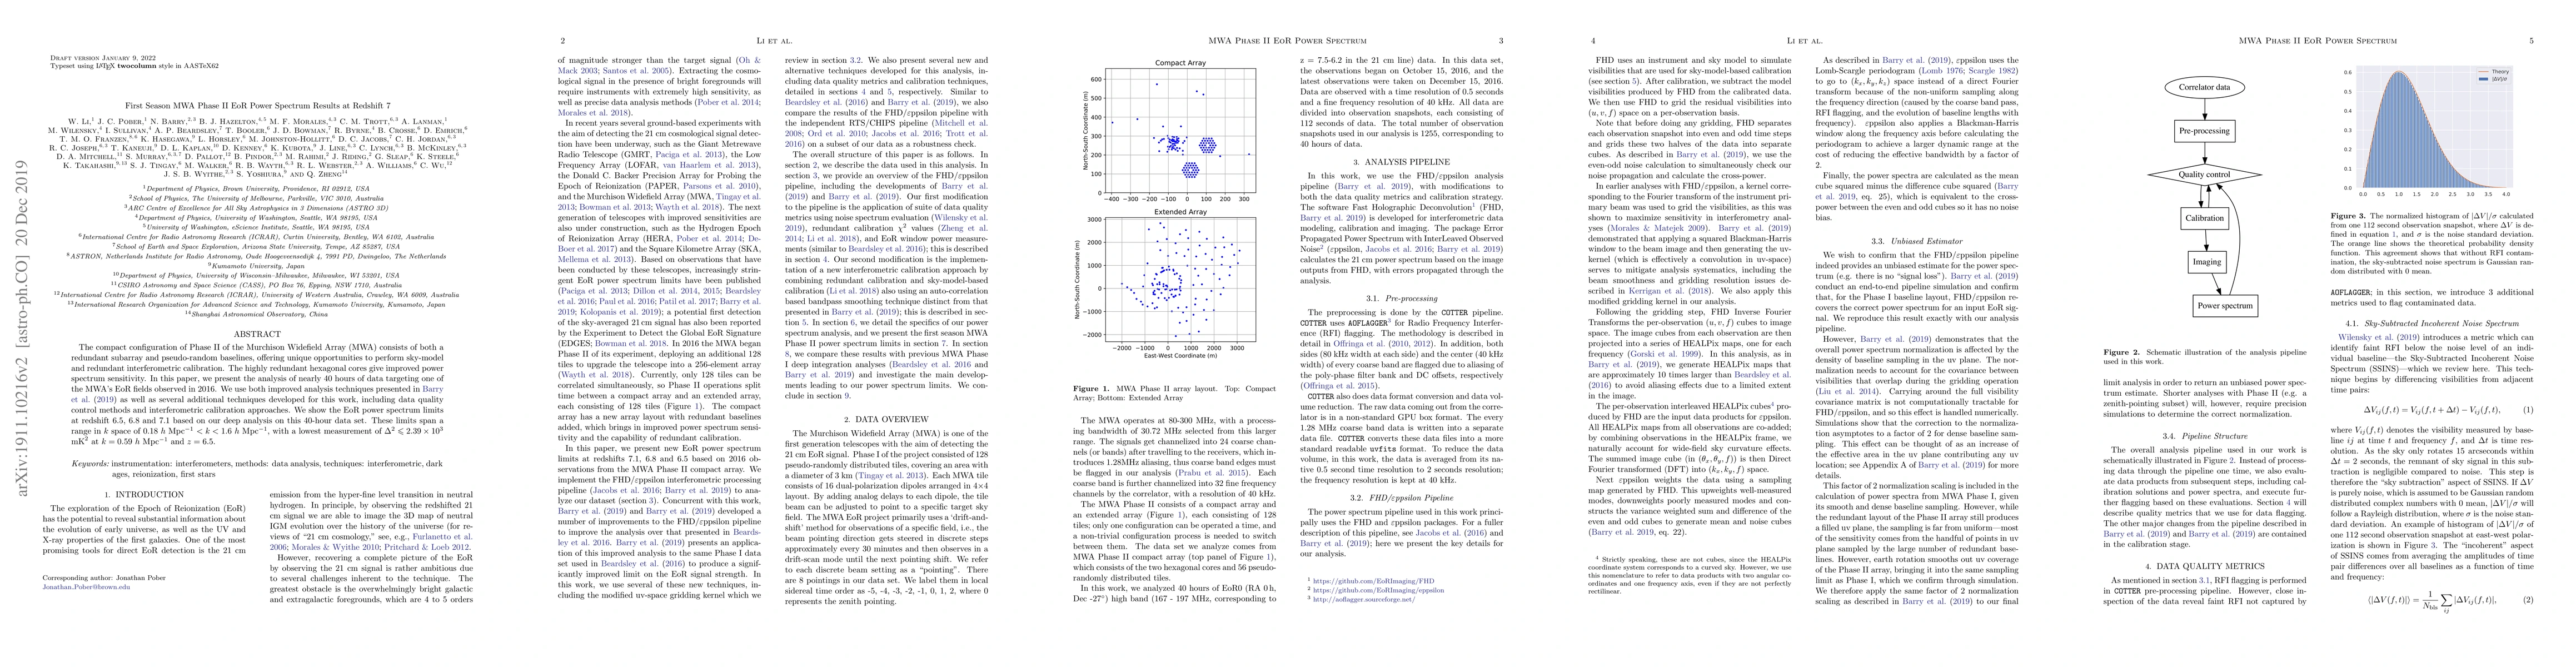
The compact configuration of Phase II of the Murchison Widefield Array (MWA) consists of both a redundant subarray and pseudo-random baselines, offering unique opportunities to perform sky-model and redundant interferometric calibration. The highly redundant hexagonal cores give improved power spectrum sensitivity. In this paper, we present the analysis of nearly 40 hours of data targeting one of the MWA's EoR fields observed in 2016. We use both improved analysis techniques presented in Barry et al. (2019) as well as several additional techniques developed for this work, including data quality control methods and interferometric calibration approaches. We show the EoR power spectrum limits at redshift 6.5, 6.8 and 7.1 based on our deep analysis on this 40-hour data set. These limits span a range in $k$ space of $0.18$ $h$ $\mathrm{Mpc^{-1}}$ $
AI Key Findings
Get AI-generated insights about this paper's methodology, results, significance, and more — seven facets brought into focus.
Impact
Paper Details
Authors
PDF Preview
Key Terms
Citation Network
Current paper (gray), citations (green), references (blue)
Display is limited for performance on very large graphs.
Discussion 0