New EoR Power Spectrum Limits From MWA Phase II Using the Delay Spectrum Method and Novel Systematic Rejection
Publication
Metrics
AI Quick Summary
This paper analyzes Epoch of Reionization data from MWA Phase II using the \texttt{simpleDS} delay spectrum pipeline, achieving new limits on the 21 cm power spectrum amplitude. The study identifies and mitigates a novel systematic bias, emphasizing the importance of accurately modeling systematics to avoid misinterpreting foreground-contaminated measurements.
Paper Preview
Abstract
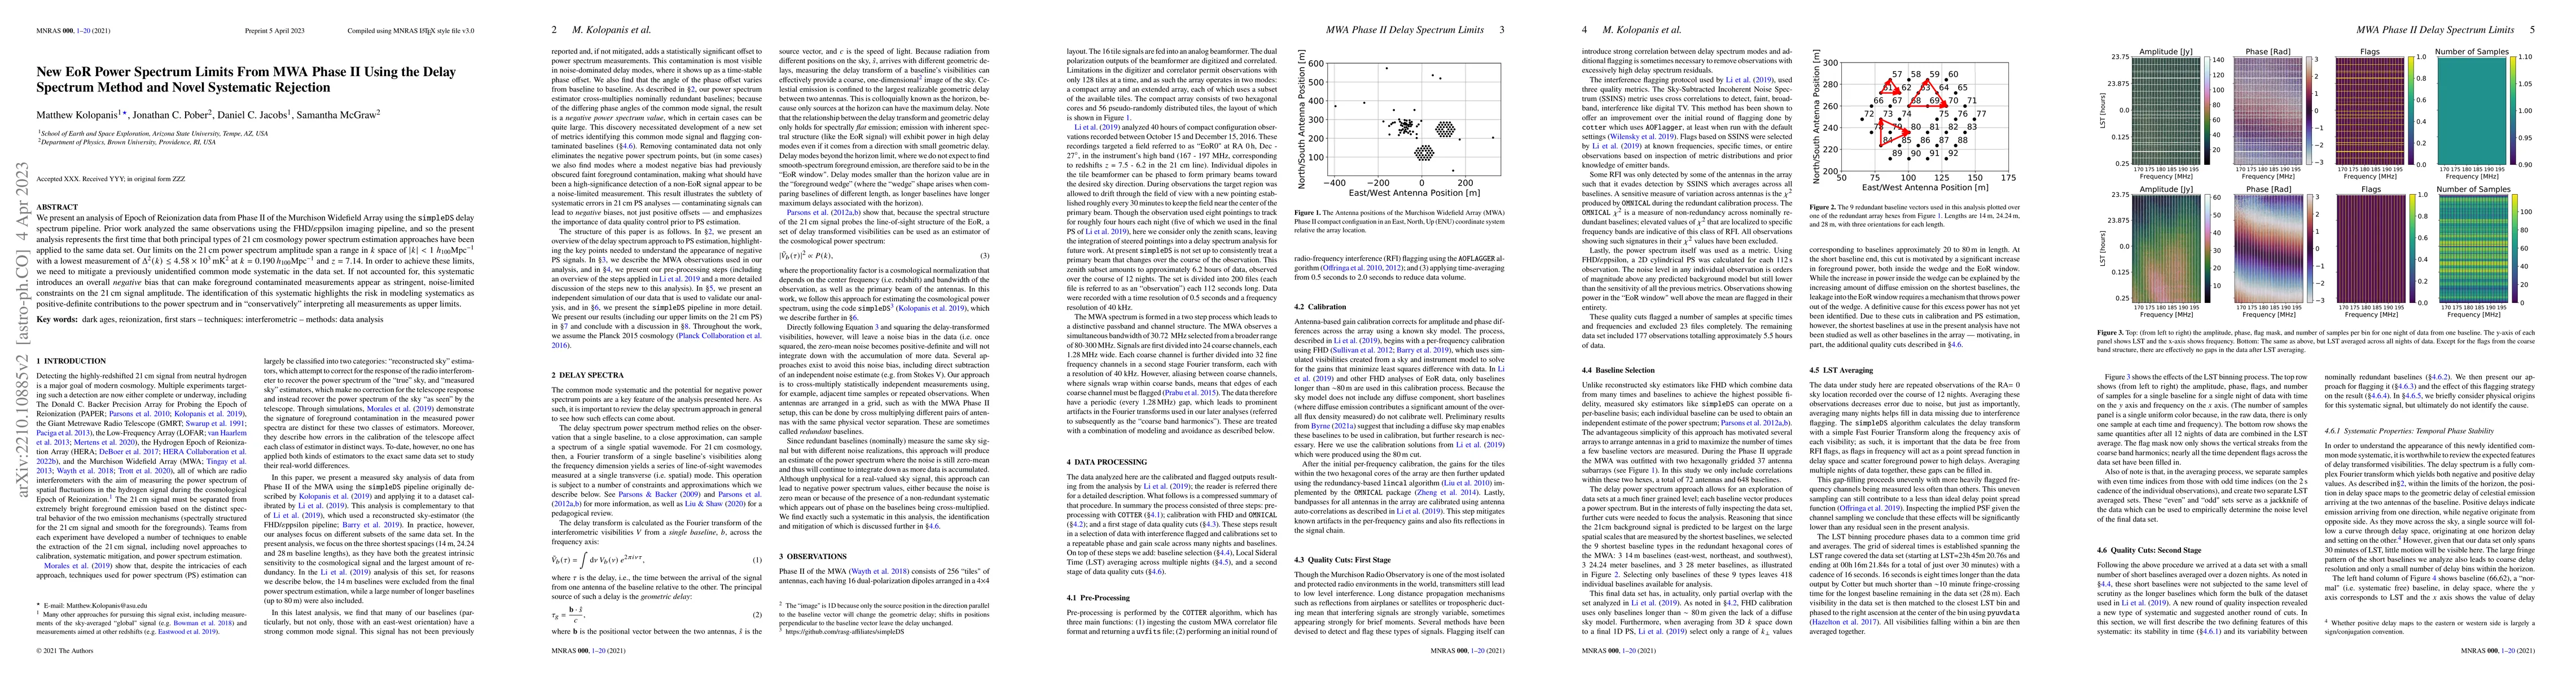
We present an analysis of Epoch of Reionization data from Phase II of the Murchison Widefield Array using the \texttt{simpleDS} delay spectrum pipeline. Prior work analyzed the same observations using the FHD/$\varepsilon$ppsilon imaging pipeline, and so the present analysis represents the first time that both principal types of 21 cm cosmology power spectrum estimation approaches have been applied to the same data set. Our limits on the 21 cm power spectrum amplitude span a range in $k$ space of $|k| < 1~h_{100}{\rm Mpc}^{-1}$ with a lowest measurement of $\Delta^2(k) \leq$ $4.58\times10^3$ mK$^2$ at $k = 0.190 h_{100}\rm{Mpc}^{-1}$ and $z = 7.14$. In order to achieve these limits, we need to mitigate a previously unidentified common mode systematic in the data set. If not accounted for, this systematic introduces an overall \emph{negative} bias that can make foreground contaminated measurements appear as stringent, noise-limited constraints on the 21 cm signal amplitude. The identification of this systematic highlights the risk in modeling systematics as positive-definite contributions to the power spectrum and in ``conservatively'' interpreting all measurements as upper limits.
AI Key Findings
Get AI-generated insights about this paper's methodology, results, significance, and more — seven facets brought into focus.
Impact
Paper Details
Authors
PDF Preview
Key Terms
Citation Network
Current paper (gray), citations (green), references (blue)
Display is limited for performance on very large graphs.
Discussion 0