Forecasting Financial Market Structure from Network Features using Machine Learning
Publication
Metrics
AI Quick Summary
This paper proposes a machine learning model to forecast financial market correlation structure using dynamic asset network features. The model shows significant improvement over traditional benchmarks, highlighting the importance of non-pair-wise correlation features for long-term predictions, and can enhance portfolio selection and risk management.
Paper Preview
Abstract
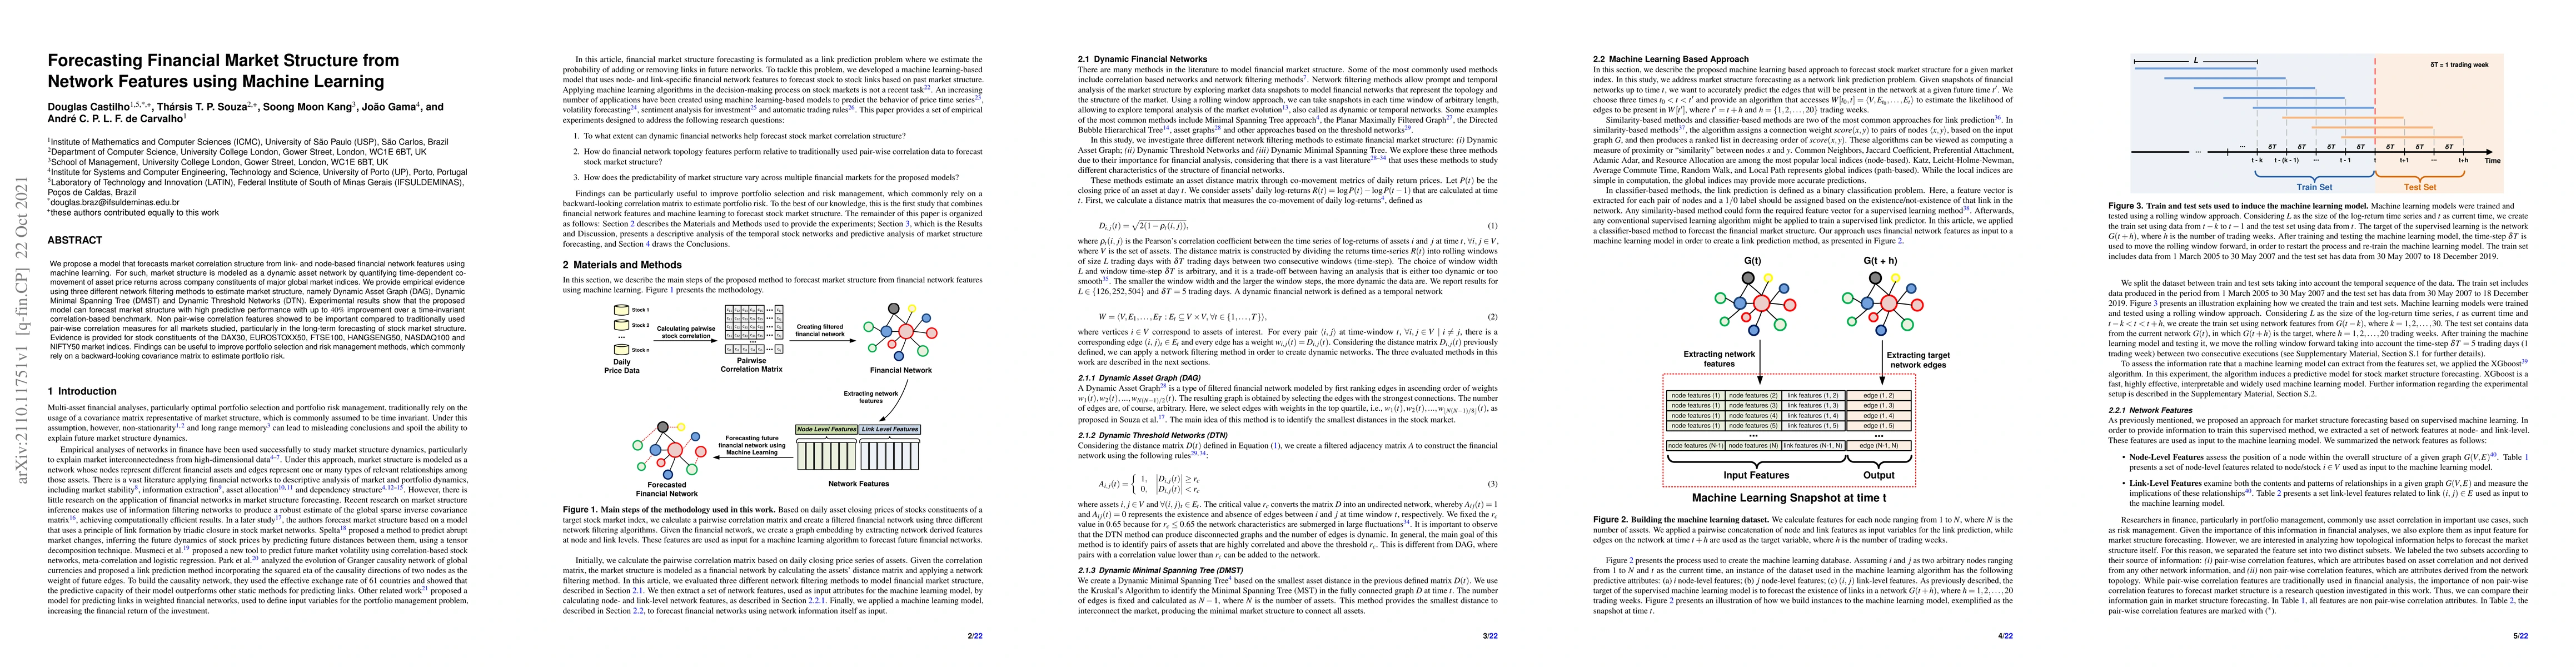
We propose a model that forecasts market correlation structure from link- and node-based financial network features using machine learning. For such, market structure is modeled as a dynamic asset network by quantifying time-dependent co-movement of asset price returns across company constituents of major global market indices. We provide empirical evidence using three different network filtering methods to estimate market structure, namely Dynamic Asset Graph (DAG), Dynamic Minimal Spanning Tree (DMST) and Dynamic Threshold Networks (DTN). Experimental results show that the proposed model can forecast market structure with high predictive performance with up to $40\%$ improvement over a time-invariant correlation-based benchmark. Non-pair-wise correlation features showed to be important compared to traditionally used pair-wise correlation measures for all markets studied, particularly in the long-term forecasting of stock market structure. Evidence is provided for stock constituents of the DAX30, EUROSTOXX50, FTSE100, HANGSENG50, NASDAQ100 and NIFTY50 market indices. Findings can be useful to improve portfolio selection and risk management methods, which commonly rely on a backward-looking covariance matrix to estimate portfolio risk.
AI Key Findings
Get AI-generated insights about this paper's methodology, results, significance, and more — seven facets brought into focus.
Impact
Paper Details
Authors
PDF Preview
Key Terms
Citation Network
Current paper (gray), citations (green), references (blue)
Display is limited for performance on very large graphs.
Discussion 0