Forecasting high-dimensional functional time series with dual-factor structures
Publication
Metrics
AI Quick Summary
This paper introduces a dual-factor model for forecasting high-dimensional functional time series, decomposing it into common and population-specific components, and demonstrates improved forecasting accuracy for subnational mortality rates in Japan with financial implications for life annuity pricing.
Paper Preview
Abstract
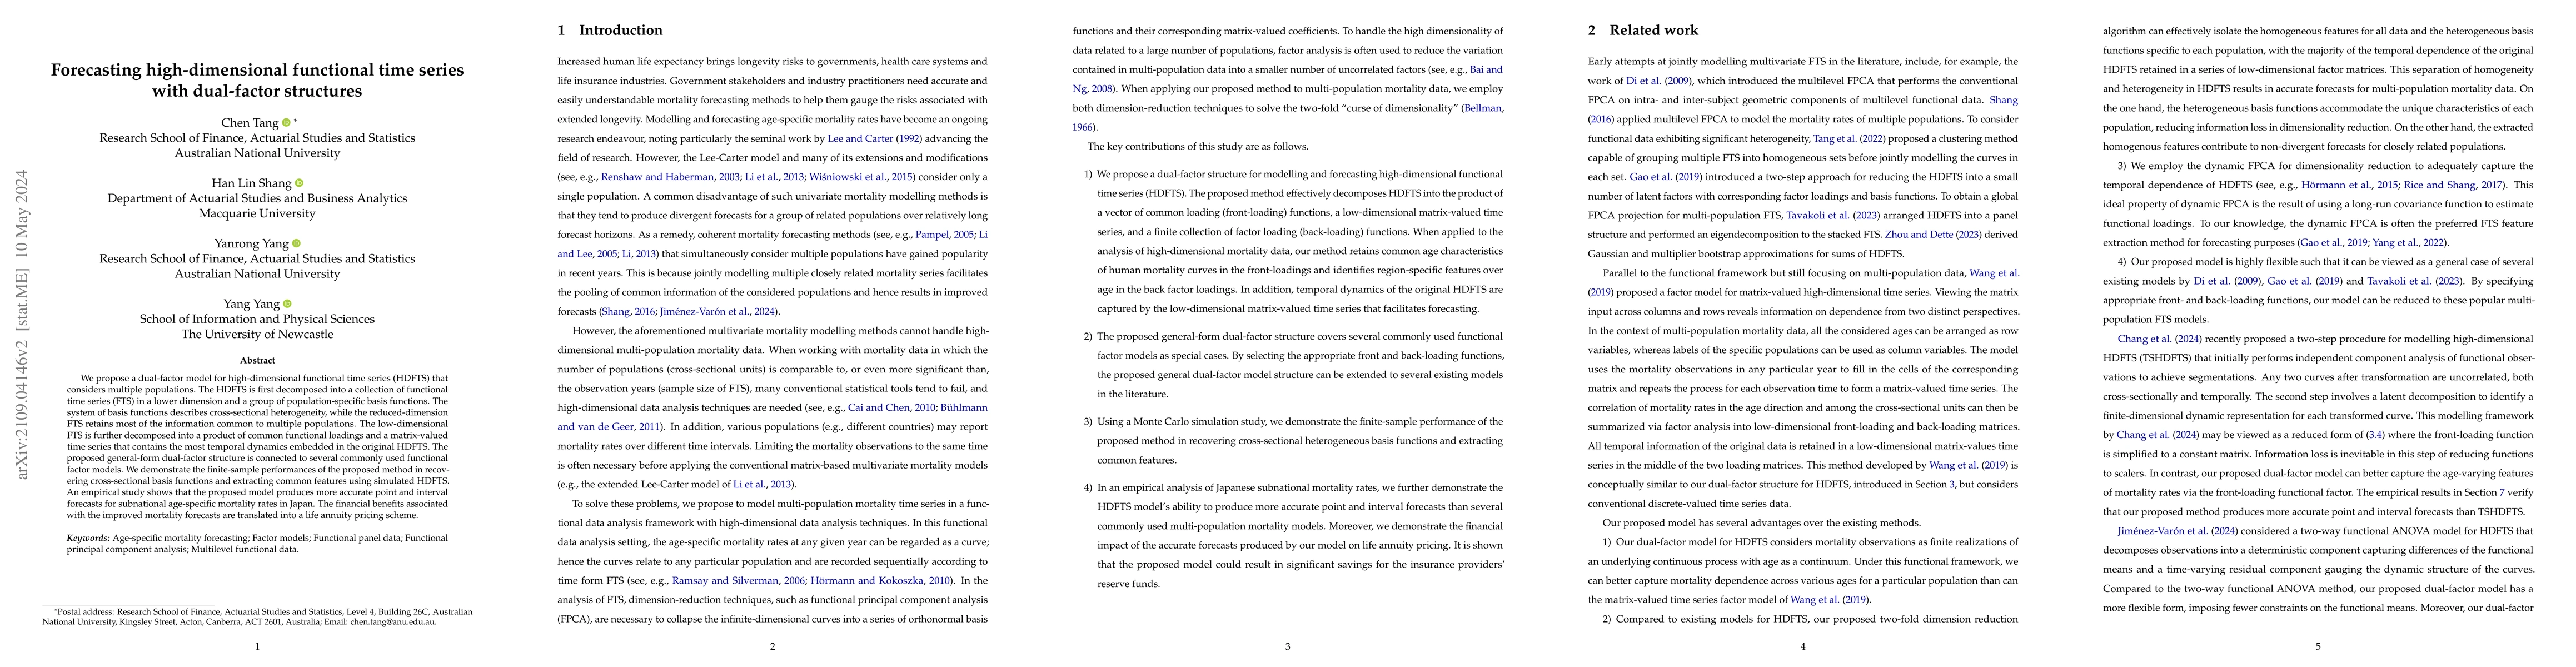
We propose a dual-factor model for high-dimensional functional time series (HDFTS) that considers multiple populations. The HDFTS is first decomposed into a collection of functional time series (FTS) in a lower dimension and a group of population-specific basis functions. The system of basis functions describes cross-sectional heterogeneity, while the reduced-dimension FTS retains most of the information common to multiple populations. The low-dimensional FTS is further decomposed into a product of common functional loadings and a matrix-valued time series that contains the most temporal dynamics embedded in the original HDFTS. The proposed general-form dual-factor structure is connected to several commonly used functional factor models. We demonstrate the finite-sample performances of the proposed method in recovering cross-sectional basis functions and extracting common features using simulated HDFTS. An empirical study shows that the proposed model produces more accurate point and interval forecasts for subnational age-specific mortality rates in Japan. The financial benefits associated with the improved mortality forecasts are translated into a life annuity pricing scheme.
AI Key Findings
Get AI-generated insights about this paper's methodology, results, significance, and more — seven facets brought into focus.
Impact
Paper Details
Authors
PDF Preview
Key Terms
Citation Network
Current paper (gray), citations (green), references (blue)
Display is limited for performance on very large graphs.
Discussion 0