01
MethodologyHow they did it
The research used a combination of lattice QCD simulations and analytical continuation to study the QCD phase diagram.
This paper evaluates the extrapolation method used to transition from imaginary to real chemical potentials in QCD, employing a functional approach to avoid the sign problem. The study finds the analytically continued crossover line matches well with the calculated one up to 80% of the critical endpoint, but breaks down beyond this point.
This paper evaluates the extrapolation method used to transition from imaginary to real chemical potentials in QCD, employing a functional approach to avoid the sign problem. The study finds the analytically continued crossover line matches well with the calculated one up to 80% of the critical endpoint, but breaks down beyond this point.
The research used a combination of lattice QCD simulations and analytical continuation to study the QCD phase diagram. More in Methodology →
The critical endpoint was found to be at a real chemical potential of approximately 0.5 GeV. — The equation of state was successfully extrapolated to real chemical potentials using a Padé approach. More in Key Results →
This work provides new insights into the QCD phase diagram and its connection to the critical endpoint. More in Significance →
The lattice simulations were limited by the size of the system and the number of configurations available. — The analytical continuation approach was sensitive to the choice of parameters and regularization scheme. More in Limitations →
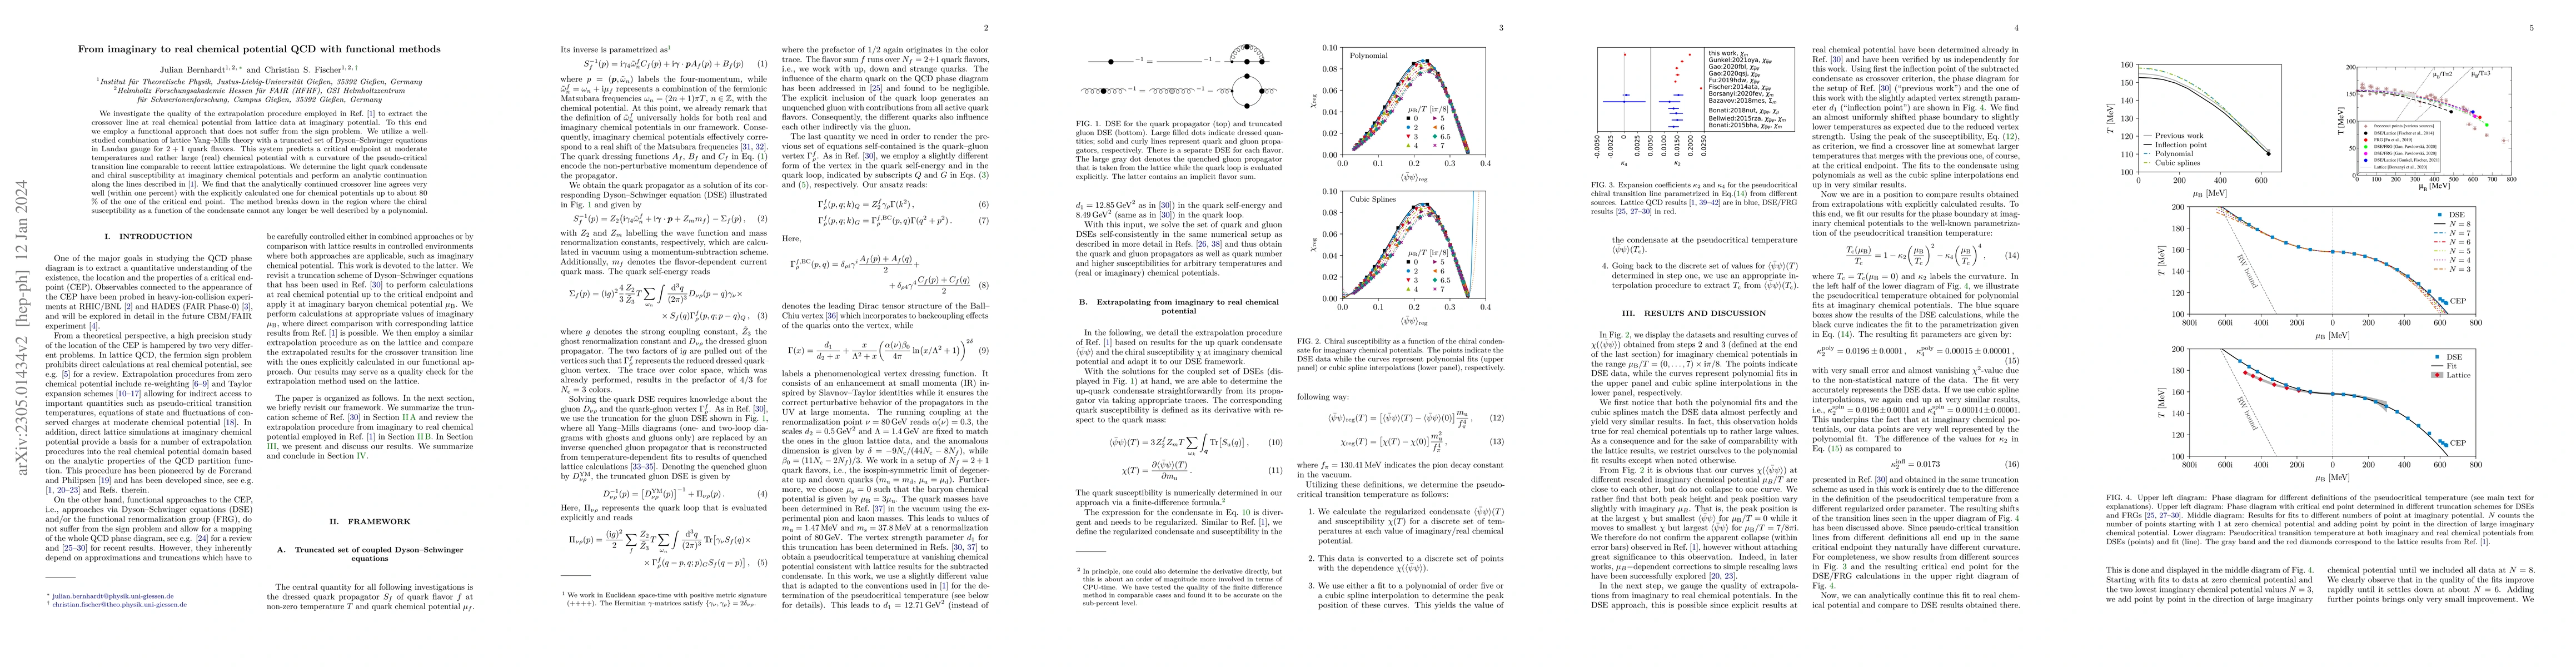
We investigate the quality of the extrapolation procedure employed in Ref. [1] to extract the crossover line at real chemical potential from lattice data at imaginary potential. To this end we employ a functional approach that does not suffer from the sign problem. We utilize a well-studied combination of lattice Yang--Mills theory with a truncated set of Dyson--Schwinger equations in Landau gauge for $2 + 1$ quark flavors. This system predicts a critical endpoint at moderate temperatures and rather large (real) chemical potential with a curvature of the pseudo-critical transition line comparable to recent lattice extrapolations. We determine the light quark condensate and chiral susceptibility at imaginary chemical potentials and perform an analytic continuation along the lines described in [1]. We find that the analytically continued crossover line agrees very well (within one percent) with the explicitly calculated one for chemical potentials up to about 80 % of the one of the critical end point. The method breaks down in the region where the chiral susceptibility as a function of the condensate cannot any longer be well described by a polynomial.
Seven facets of this paper, analysed and brought into focus by AI.
This work provides new insights into the QCD phase diagram and its connection to the critical endpoint.
The research used a combination of lattice QCD simulations and analytical continuation to study the QCD phase diagram.
This work provides new insights into the QCD phase diagram and its connection to the critical endpoint.
The development and implementation of a new algorithm for analytical continuation using Dyson-Schwinger equations.
This work presents a novel approach to studying the QCD phase diagram, combining lattice simulations with analytical continuation.
Current paper (gray), citations (green), references (blue)
Display is limited for performance on very large graphs.
Discussion 0