Publication
Metrics
AI Quick Summary
This paper introduces a conceptual framework for glyph-based visualization that enables interactive sorting of multivariate data, enhancing comparative analysis and multi-dimensional visual search. The system demonstrates usability through a case study in rugby event analysis, revealing new insights beyond traditional methods.
Paper Preview
Abstract
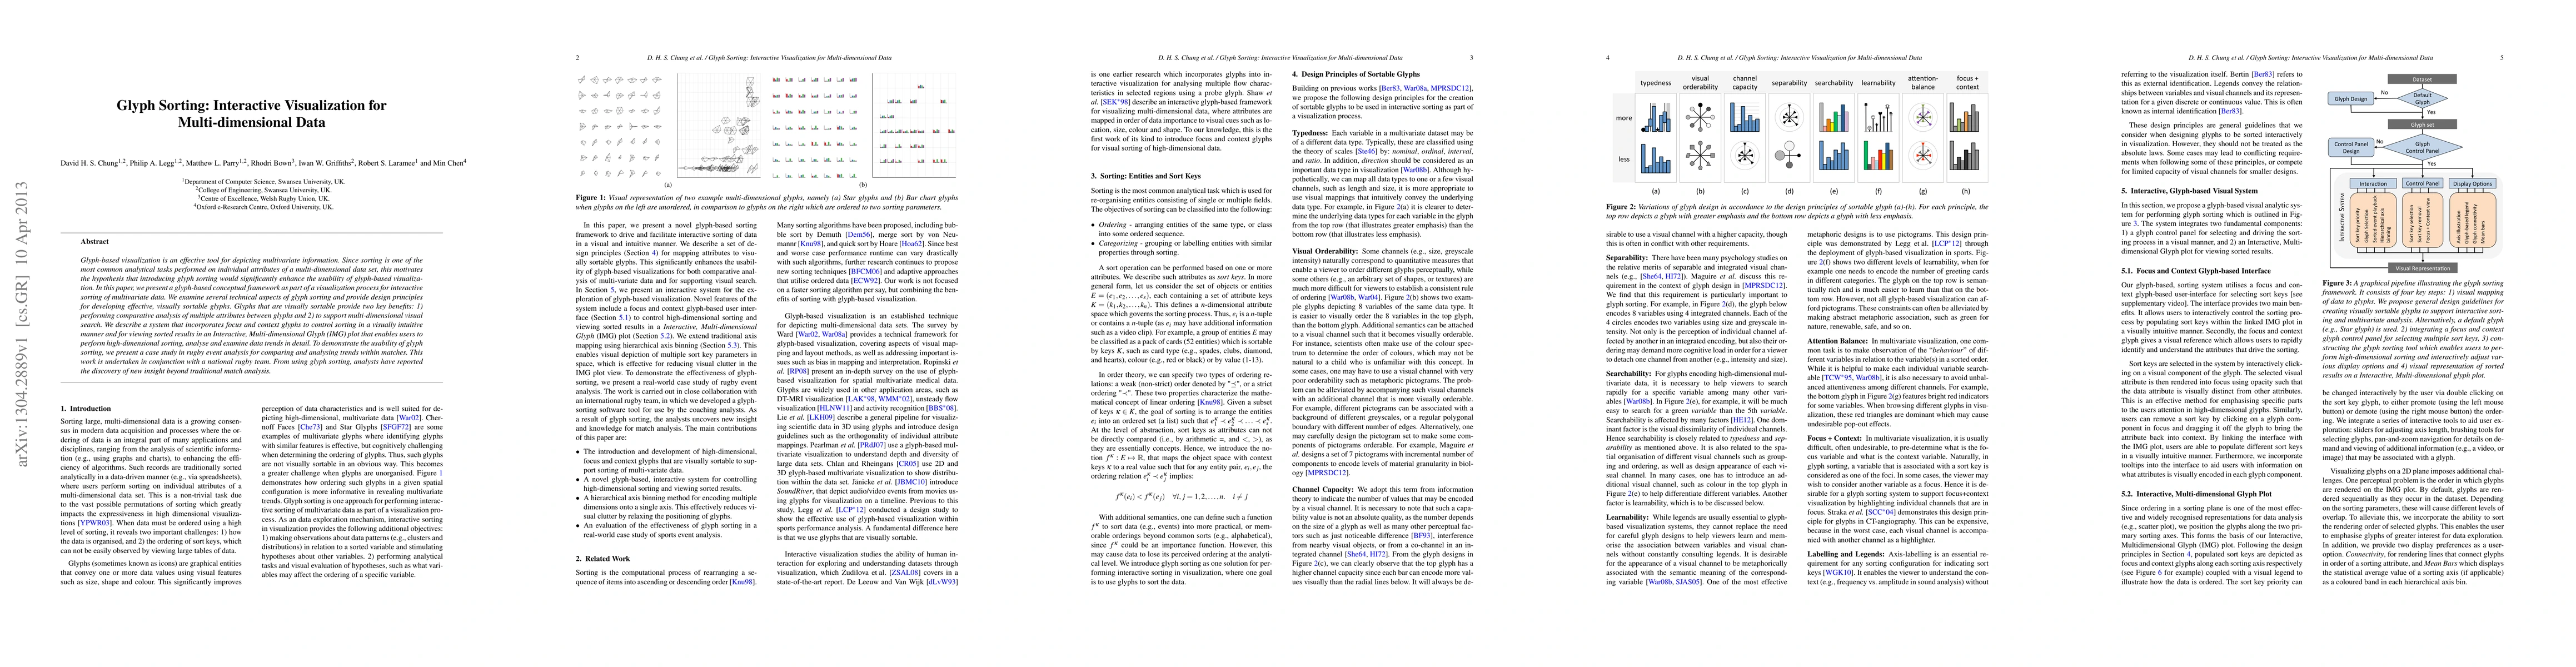
Glyph-based visualization is an effective tool for depicting multivariate information. Since sorting is one of the most common analytical tasks performed on individual attributes of a multi-dimensional data set, this motivates the hypothesis that introducing glyph sorting would significantly enhance the usability of glyph-based visualization. In this paper, we present a glyph-based conceptual framework as part of a visualization process for interactive sorting of multivariate data. We examine several technical aspects of glyph sorting and provide design principles for developing effective, visually sortable glyphs. Glyphs that are visually sortable provide two key benefits: 1) performing comparative analysis of multiple attributes between glyphs and 2) to support multi-dimensional visual search. We describe a system that incorporates focus and context glyphs to control sorting in a visually intuitive manner and for viewing sorted results in an Interactive, Multi-dimensional Glyph (IMG) plot that enables users to perform high-dimensional sorting, analyse and examine data trends in detail. To demonstrate the usability of glyph sorting, we present a case study in rugby event analysis for comparing and analysing trends within matches. This work is undertaken in conjunction with a national rugby team. From using glyph sorting, analysts have reported the discovery of new insight beyond traditional match analysis.
AI Key Findings
Get AI-generated insights about this paper's methodology, results, significance, and more — seven facets brought into focus.
Impact
Paper Details
PDF Preview
Key Terms
Citation Network
Current paper (gray), citations (green), references (blue)
Display is limited for performance on very large graphs.
Discussion 0