Publication
Metrics
Paper Preview
Abstract
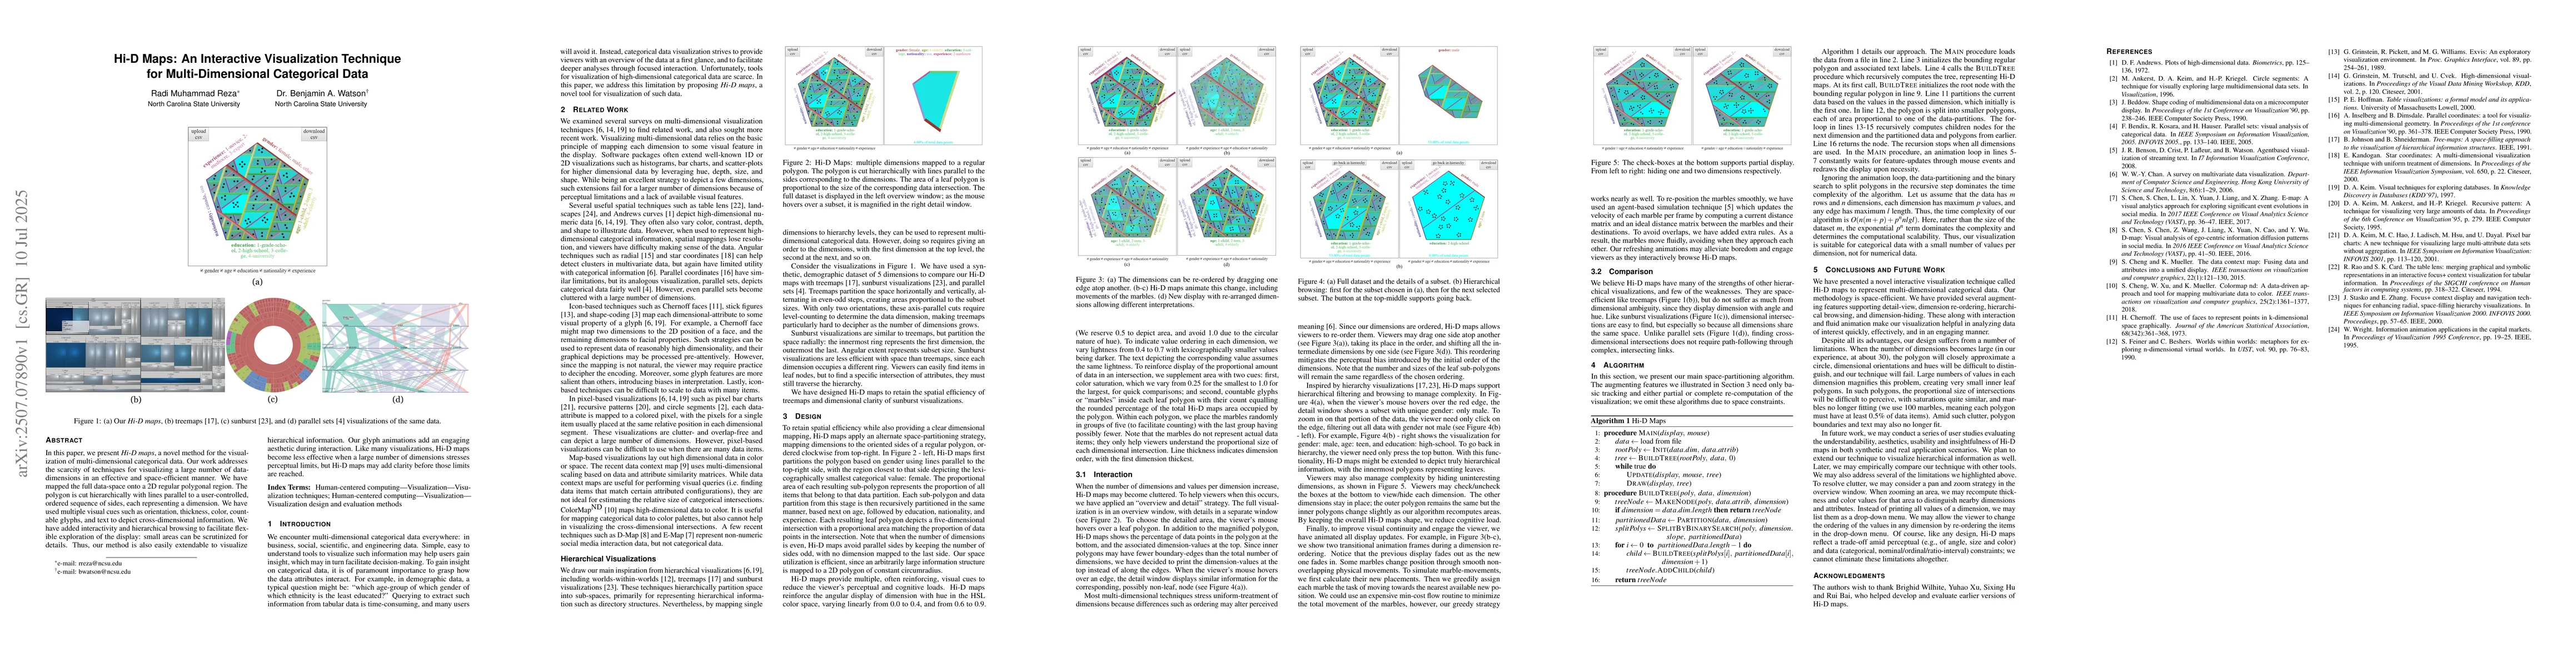
In this paper, we present Hi-D maps, a novel method for the visualization of multi-dimensional categorical data. Our work addresses the scarcity of techniques for visualizing a large number of data-dimensions in an effective and space-efficient manner. We have mapped the full data-space onto a 2D regular polygonal region. The polygon is cut hierarchically with lines parallel to a user-controlled, ordered sequence of sides, each representing a dimension. We have used multiple visual cues such as orientation, thickness, color, countable glyphs, and text to depict cross-dimensional information. We have added interactivity and hierarchical browsing to facilitate flexible exploration of the display: small areas can be scrutinized for details. Thus, our method is also easily extendable to visualize hierarchical information. Our glyph animations add an engaging aesthetic during interaction. Like many visualizations, Hi-D maps become less effective when a large number of dimensions stresses perceptual limits, but Hi-D maps may add clarity before those limits are reached.
AI Key Findings
Get AI-generated insights about this paper's methodology, results, significance, and more — seven facets brought into focus.
Impact
Authors
PDF Preview
Citation Network
Current paper (gray), citations (green), references (blue)
Display is limited for performance on very large graphs.
Discussion 0