Graph Variogram: A novel tool to measure spatial stationarity
Publication
Metrics
Paper Preview
Abstract
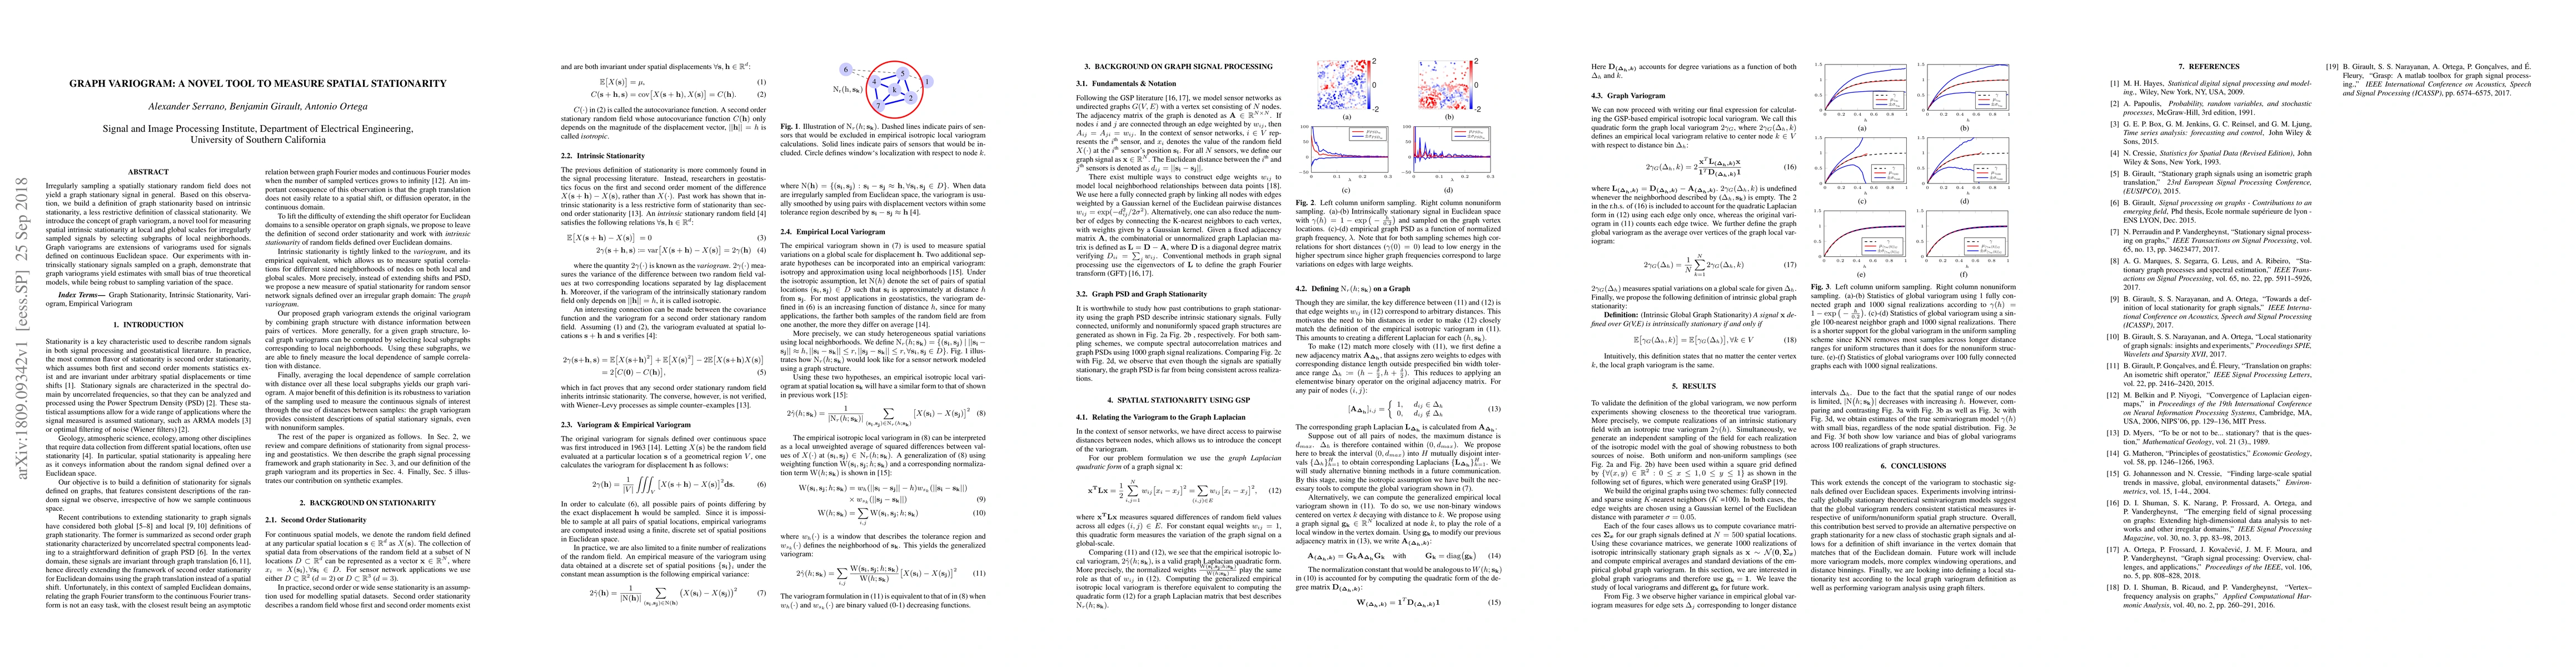
Irregularly sampling a spatially stationary random field does not yield a graph stationary signal in general. Based on this observation, we build a definition of graph stationarity based on intrinsic stationarity, a less restrictive definition of classical stationarity. We introduce the concept of graph variogram, a novel tool for measuring spatial intrinsic stationarity at local and global scales for irregularly sampled signals by selecting subgraphs of local neighborhoods. Graph variograms are extensions of variograms used for signals defined on continuous Euclidean space. Our experiments with intrinsically stationary signals sampled on a graph, demonstrate that graph variograms yield estimates with small bias of true theoretical models, while being robust to sampling variation of the space.
AI Key Findings
Get AI-generated insights about this paper's methodology, results, significance, and more — seven facets brought into focus.
Impact
Paper Details
PDF Preview
Key Terms
Citation Network
Current paper (gray), citations (green), references (blue)
Display is limited for performance on very large graphs.
Discussion 0