How to model the covariance structure in a spatial framework: variogram or correlation function?
Publication
Metrics
AI Quick Summary
This paper explores modeling the covariance structure in spatial data using either the variogram or correlation function within the framework of Kriging. It discusses the advantages and parameterization of using the variogram instead of the correlation matrix.
Paper Preview
Abstract
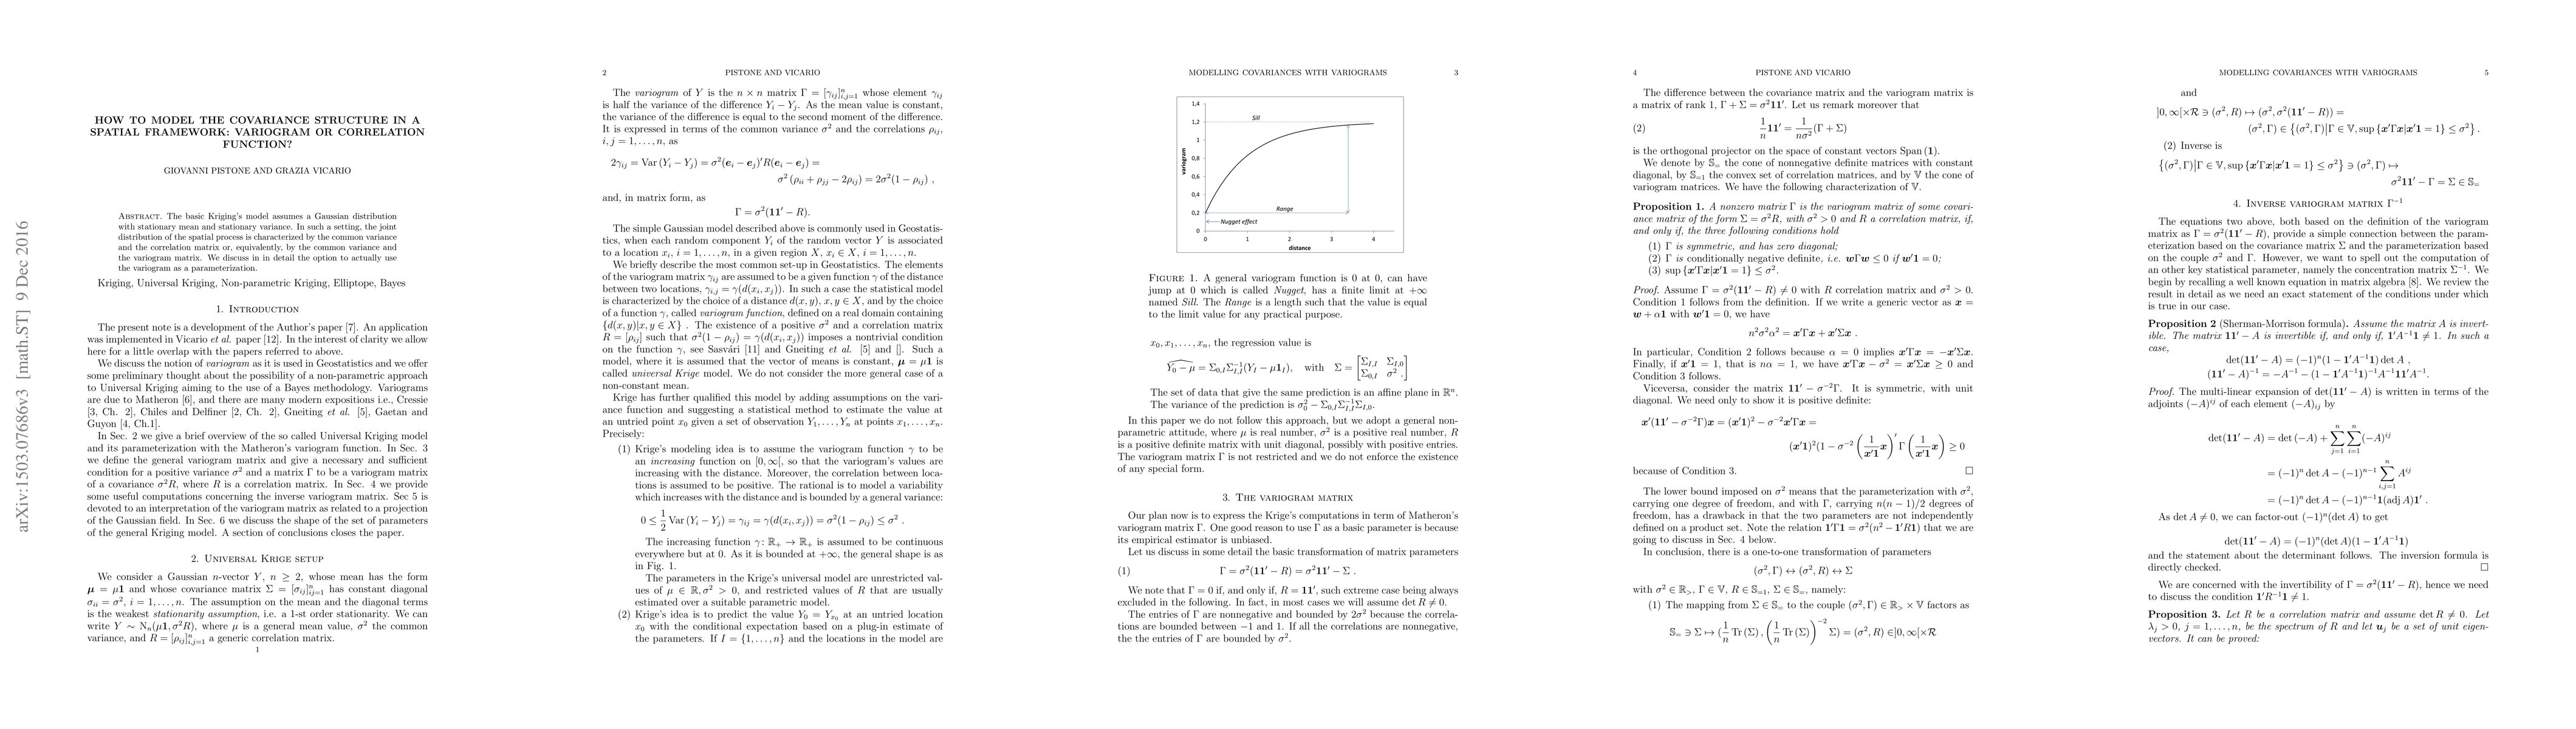
The basic Kriging's model assumes a Gaussian distribution with stationary mean and stationary variance. In such a setting, the joint distribution of the spatial process is characterized by the common variance and the correlation matrix or, equivalently, by the common variance and the variogram matrix. We discuss in in detail the option to actually use the variogram as a parameterization.
AI Key Findings
Get AI-generated insights about this paper's methodology, results, significance, and more — seven facets brought into focus.
Impact
Paper Details
PDF Preview
Key Terms
Citation Network
Current paper (gray), citations (green), references (blue)
Display is limited for performance on very large graphs.
Discussion 0