Graphical Models for Zero-Inflated Single Cell Gene Expression
Publication
Metrics
AI Quick Summary
This paper proposes a multivariate Hurdle model for analyzing zero-inflated single cell gene expression data, employing neighborhood selection and a group lasso penalty to infer gene co-regulatory networks. The method outperforms existing approaches and reveals network structures unseen in bulk data, demonstrated through applications on T follicular helper cells and mouse dendritic cells.
Paper Preview
Abstract
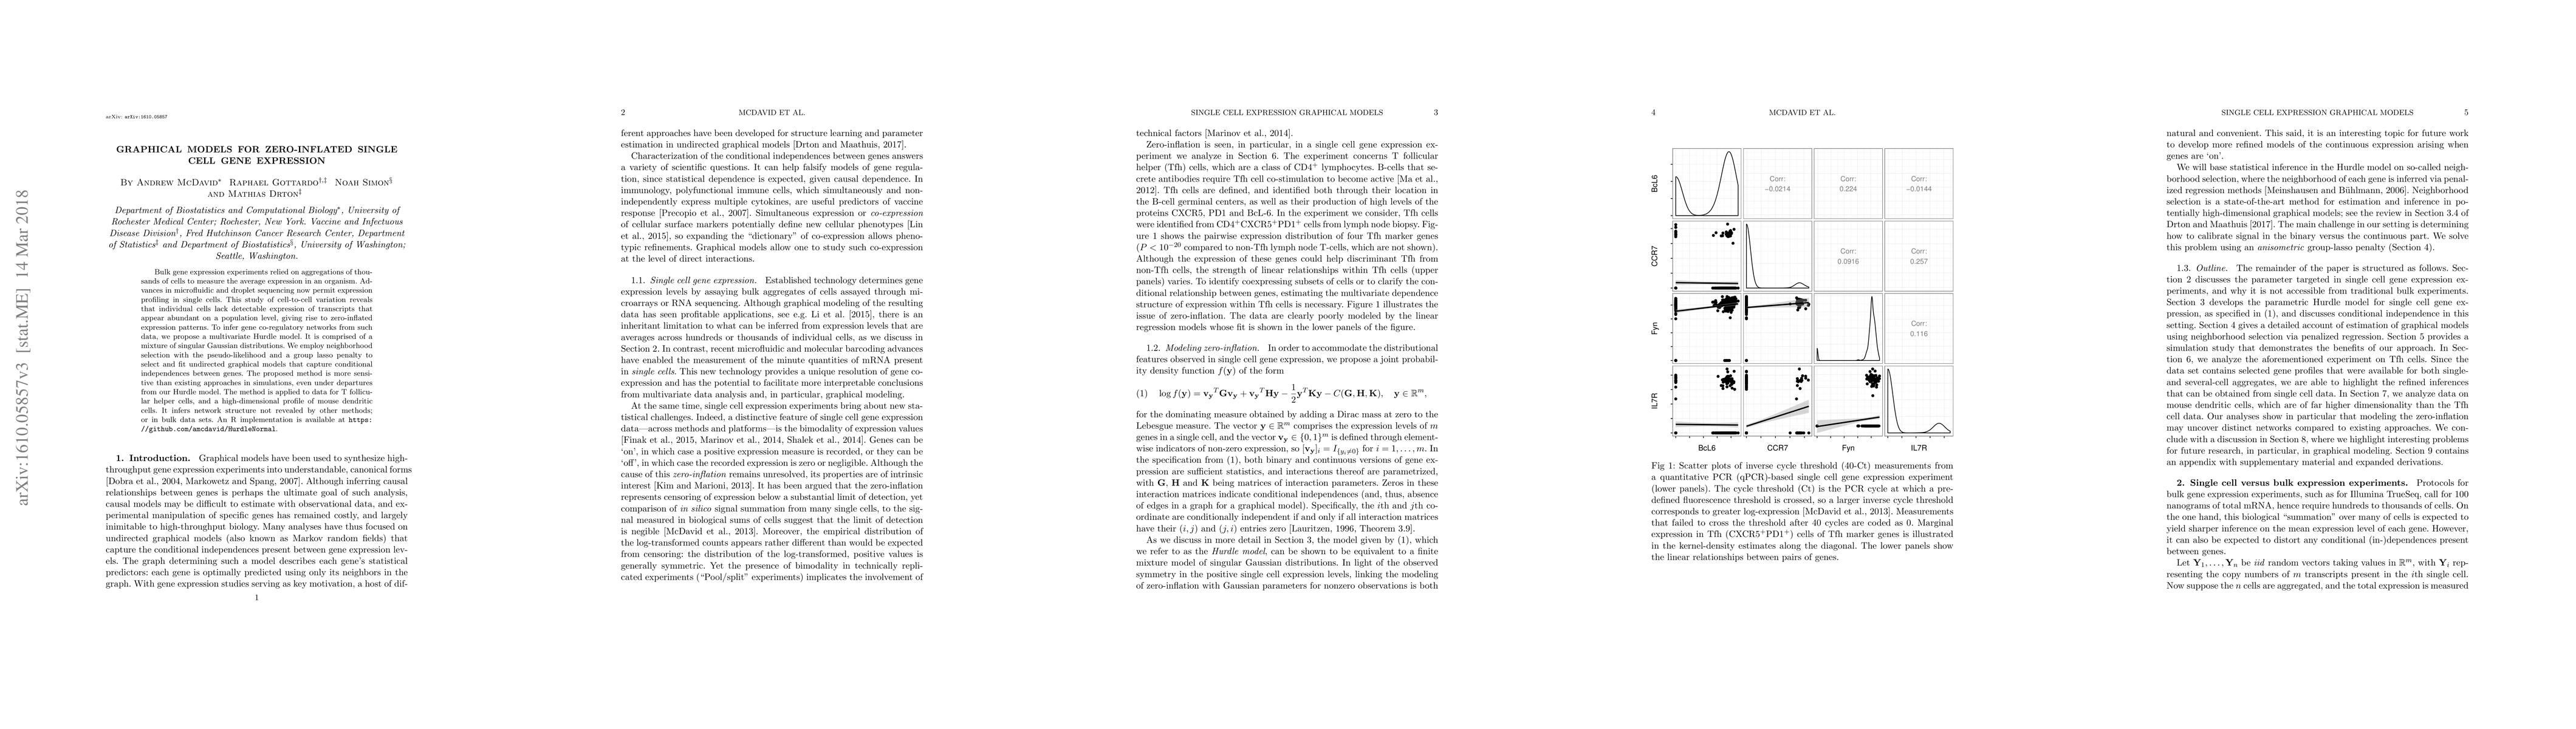
Bulk gene expression experiments relied on aggregations of thousands of cells to measure the average expression in an organism. Advances in microfluidic and droplet sequencing now permit expression profiling in single cells. This study of cell-to-cell variation reveals that individual cells lack detectable expression of transcripts that appear abundant on a population level, giving rise to zero-inflated expression patterns. To infer gene co-regulatory networks from such data, we propose a multivariate Hurdle model. It is comprised of a mixture of singular Gaussian distributions. We employ neighborhood selection with the pseudo-likelihood and a group lasso penalty to select and fit undirected graphical models that capture conditional independences between genes. The proposed method is more sensitive than existing approaches in simulations, even under departures from our Hurdle model. The method is applied to data for T follicular helper cells, and a high-dimensional profile of mouse dendritic cells. It infers network structure not revealed by other methods; or in bulk data sets. An R implementation is available at https://github.com/amcdavid/HurdleNormal .
AI Key Findings
Get AI-generated insights about this paper's methodology, results, significance, and more — seven facets brought into focus.
Impact
Paper Details
PDF Preview
Key Terms
Citation Network
Current paper (gray), citations (green), references (blue)
Display is limited for performance on very large graphs.
Discussion 0