Publication
Metrics
AI Quick Summary
This paper introduces GraphTrials, a framework for visual proofs of graph properties, emphasizing the need for specialized visualizations that ensure trustworthiness and explainability in AI-based question-answering systems. It defines visual certificates, specialized graph visualizations that leverage human perception to verify assertions, and proposes a classification system based on visual proof complexity.
Paper Preview
Abstract
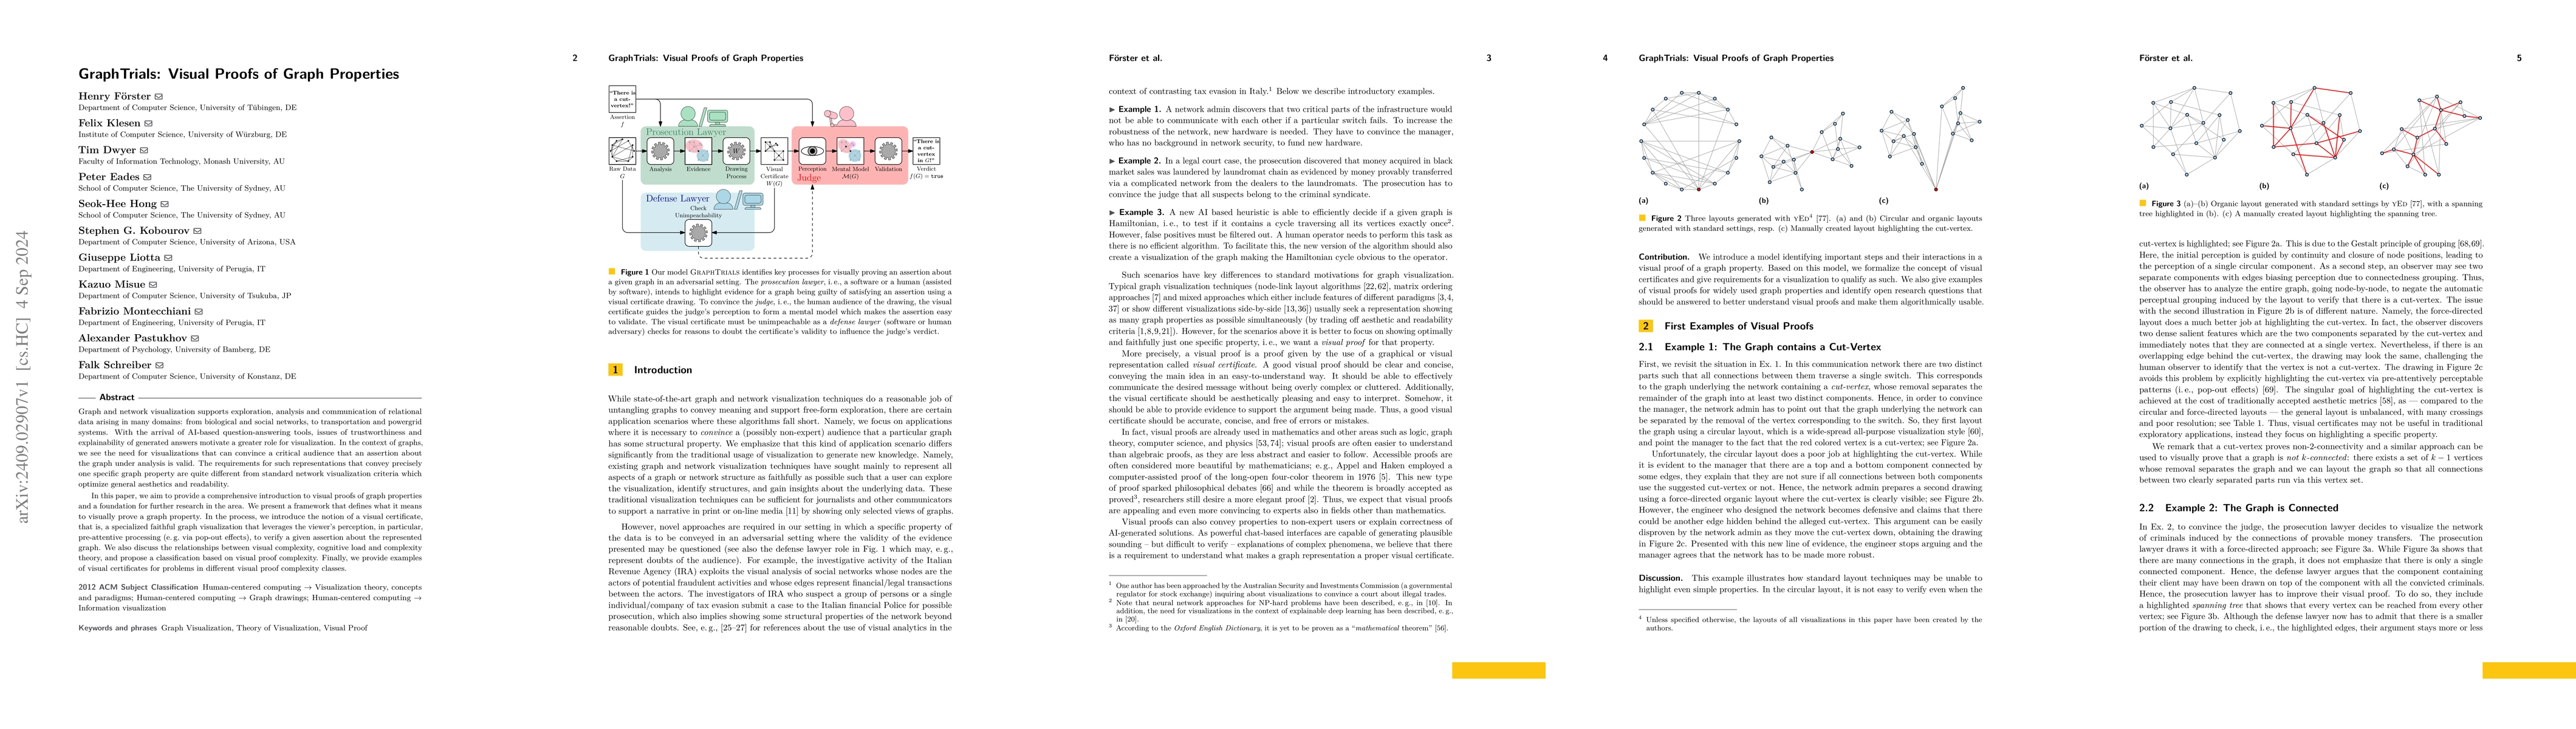
Graph and network visualization supports exploration, analysis and communication of relational data arising in many domains: from biological and social networks, to transportation and powergrid systems. With the arrival of AI-based question-answering tools, issues of trustworthiness and explainability of generated answers motivate a greater role for visualization. In the context of graphs, we see the need for visualizations that can convince a critical audience that an assertion about the graph under analysis is valid. The requirements for such representations that convey precisely one specific graph property are quite different from standard network visualization criteria which optimize general aesthetics and readability. In this paper, we aim to provide a comprehensive introduction to visual proofs of graph properties and a foundation for further research in the area. We present a framework that defines what it means to visually prove a graph property. In the process, we introduce the notion of a visual certificate, that is, a specialized faithful graph visualization that leverages the viewer's perception, in particular, pre-attentive processing (e.g. via pop-out effects), to verify a given assertion about the represented graph. We also discuss the relationships between visual complexity, cognitive load and complexity theory, and propose a classification based on visual proof complexity. Finally, we provide examples of visual certificates for problems in different visual proof complexity classes.
AI Key Findings
Get AI-generated insights about this paper's methodology, results, significance, and more — seven facets brought into focus.
Impact
Paper Details
Authors
PDF Preview
Citation Network
Current paper (gray), citations (green), references (blue)
Display is limited for performance on very large graphs.
Discussion 0