Academic Profile
Statistics
Similar Authors
Papers on arXiv
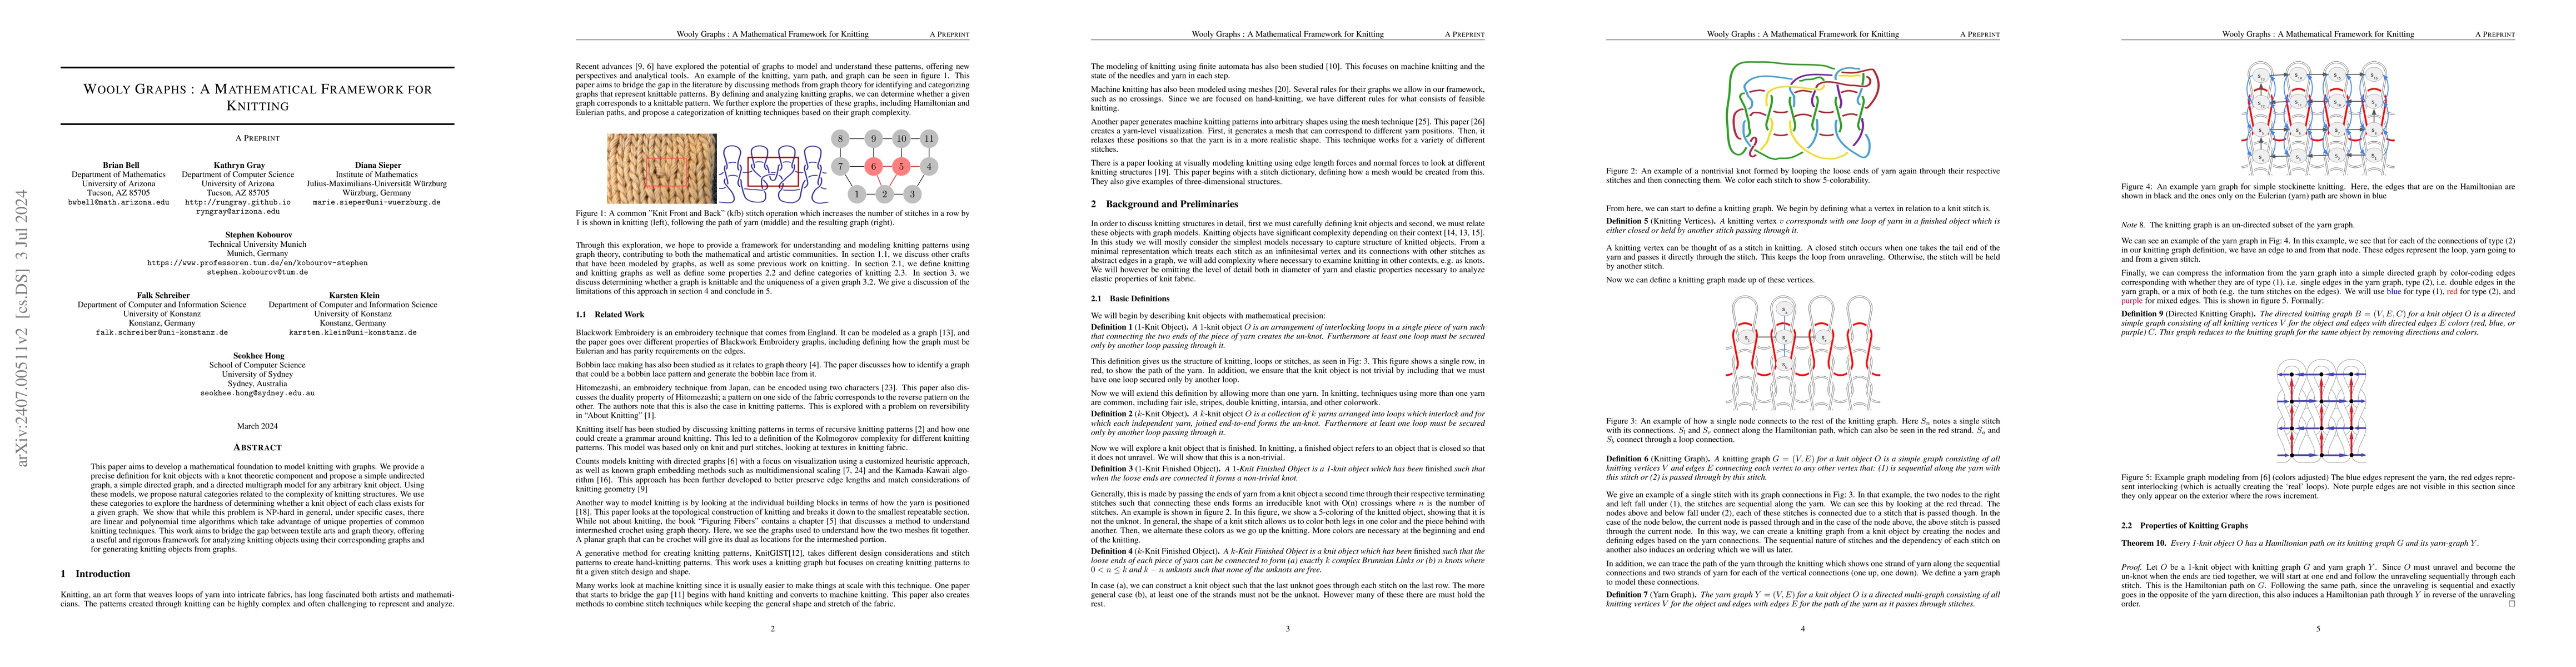
This paper aims to develop a mathematical foundation to model knitting with graphs. We provide a precise definition for knit objects with a knot theoretic component and propose a simple undirected g...
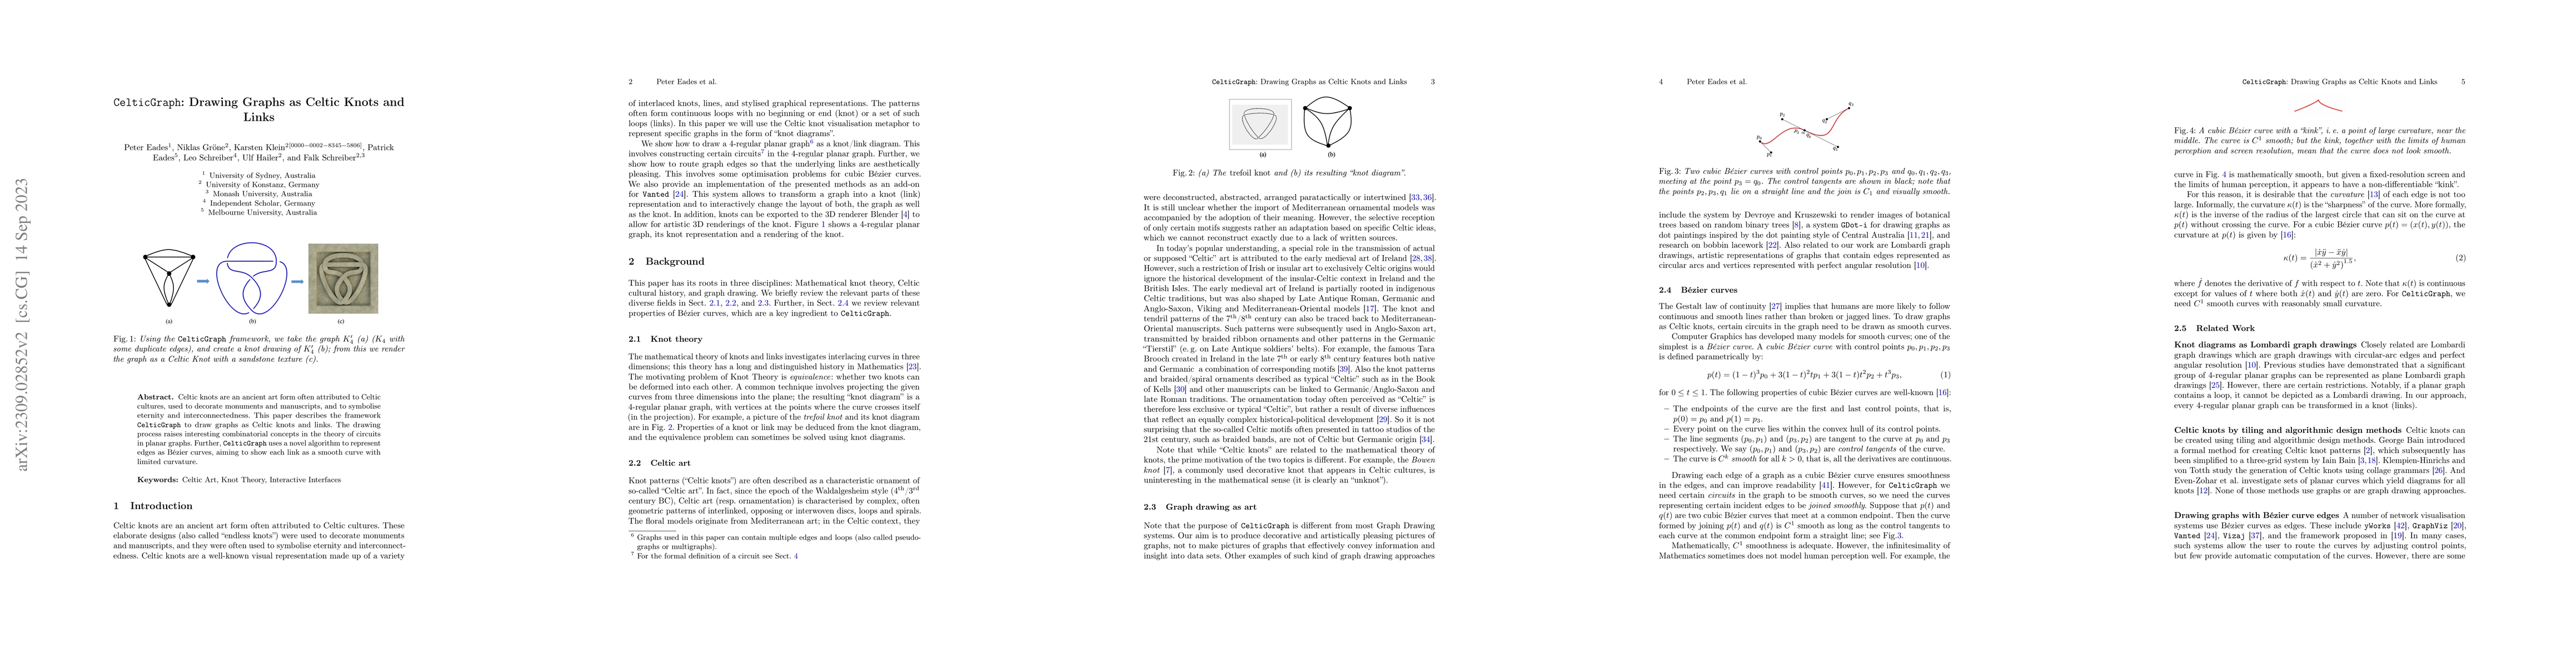
Celtic knots are an ancient art form often attributed to Celtic cultures, used to decorate monuments and manuscripts, and to symbolise eternity and interconnectedness. This paper describes the frame...
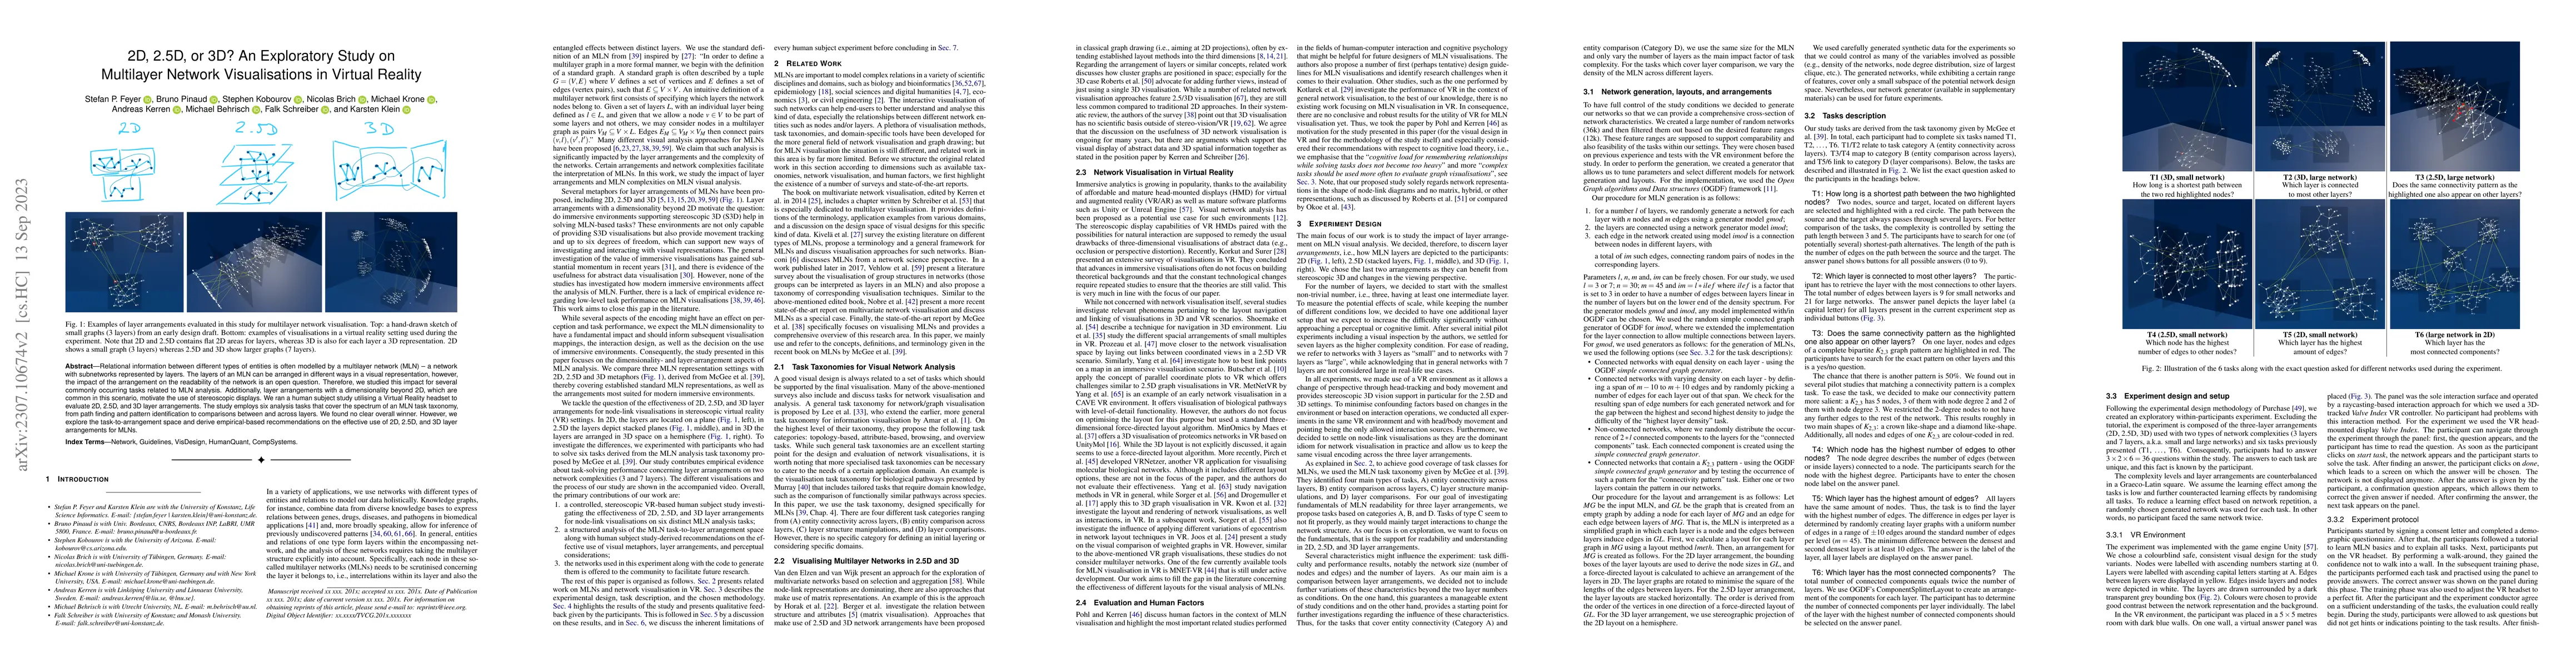
Relational information between different types of entities is often modelled by a multilayer network (MLN) -- a network with subnetworks represented by layers. The layers of an MLN can be arranged i...
The visualization of a network influences the quality of the mental map that the viewer develops to understand the network. In this study, we investigate the effects of a 3D immersive visualization ...
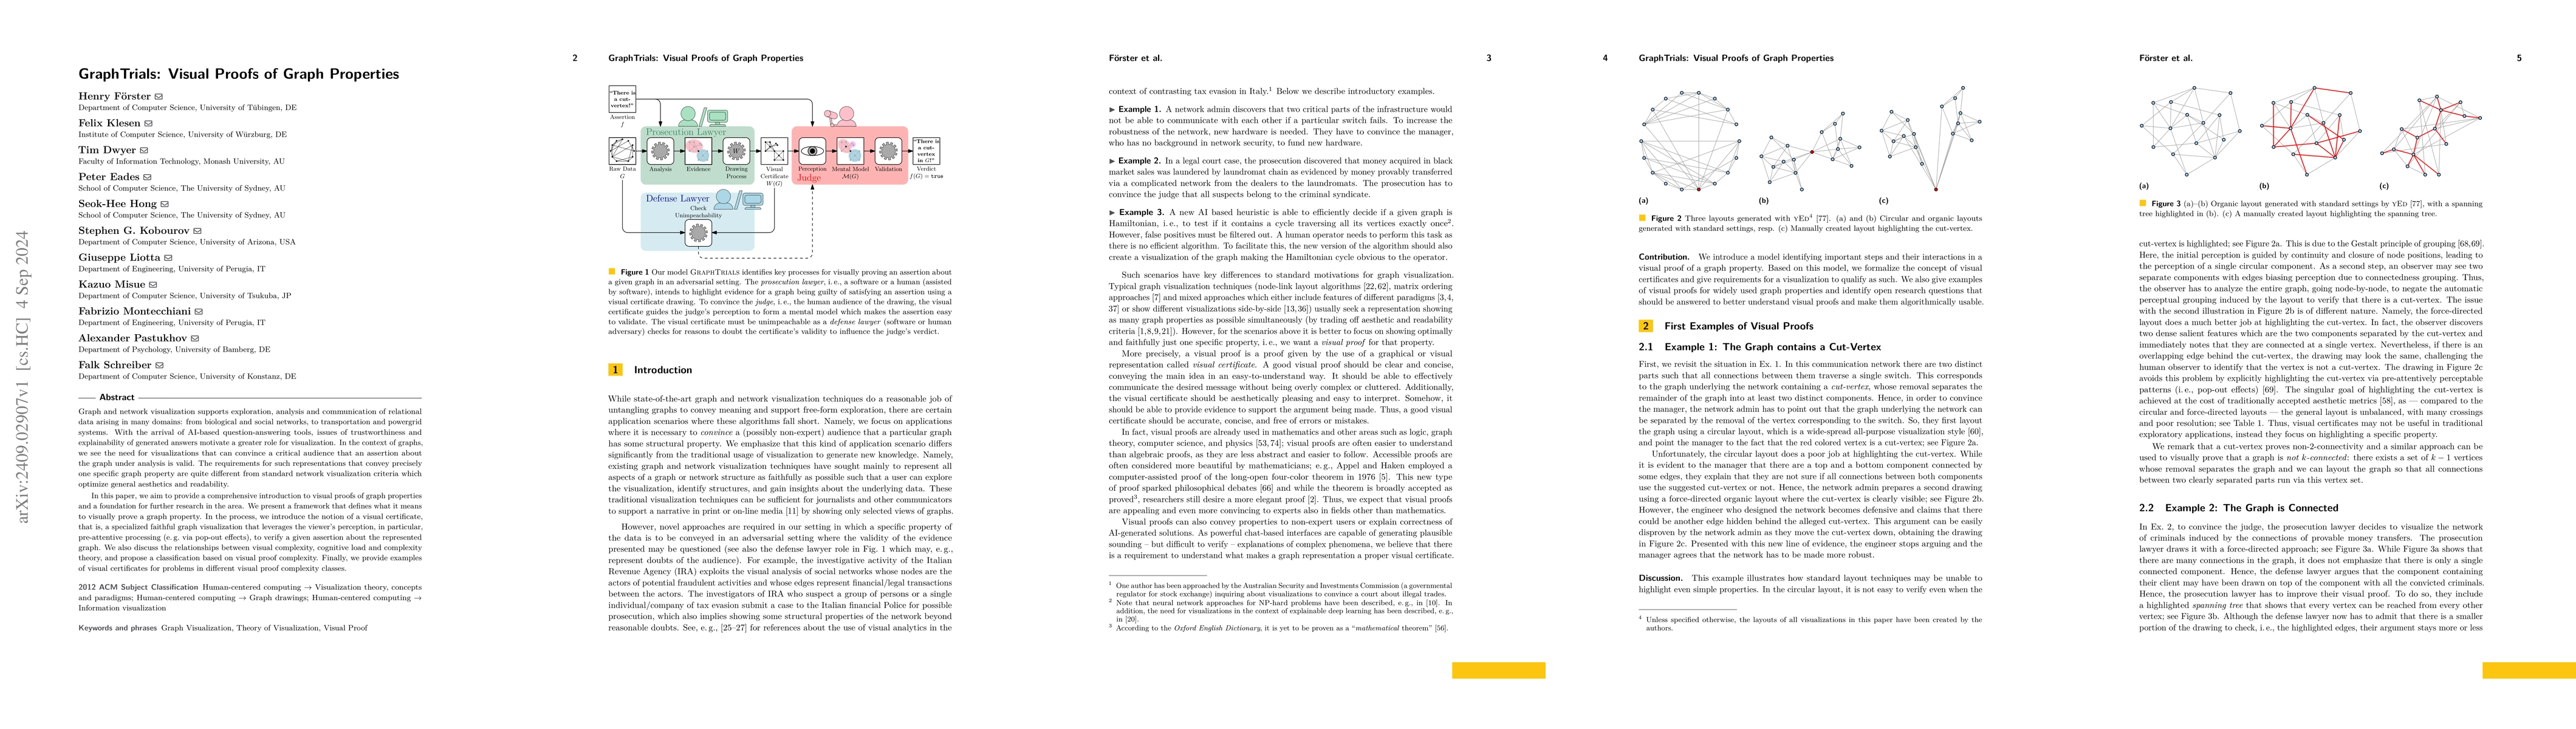
Graph and network visualization supports exploration, analysis and communication of relational data arising in many domains: from biological and social networks, to transportation and powergrid system...
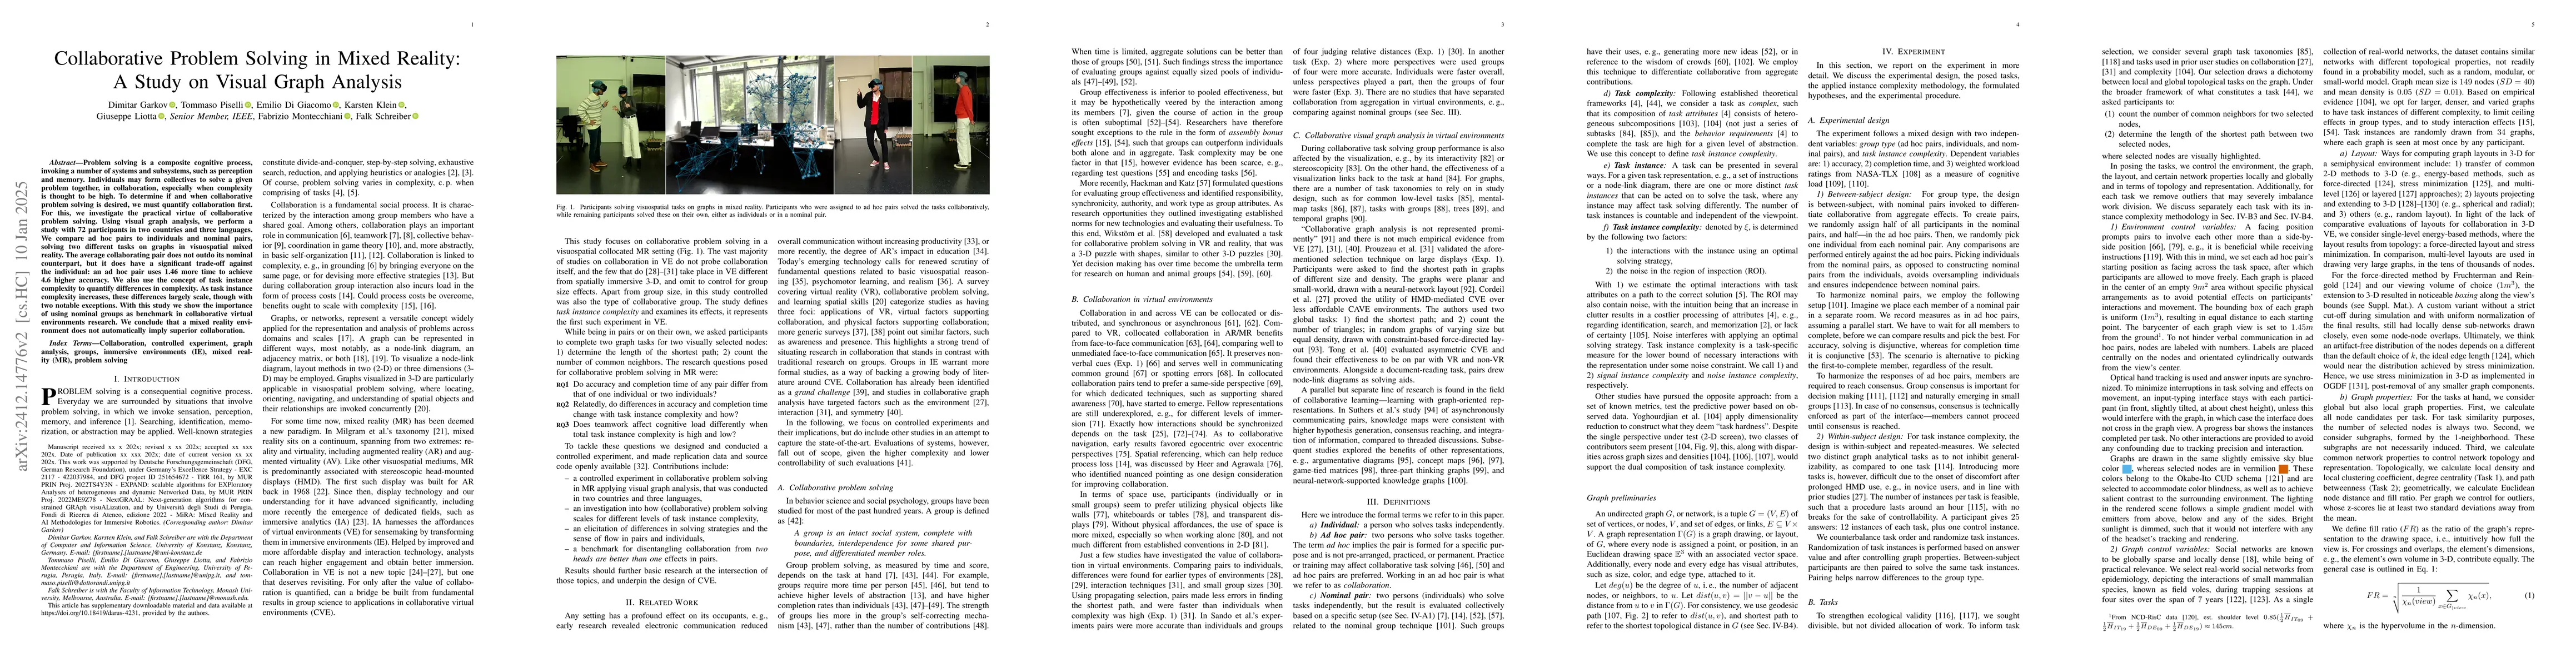
Problem solving is a composite cognitive process, invoking a number of systems and subsystems, such as perception and memory. Individuals may form collectives to solve a given problem together, in col...
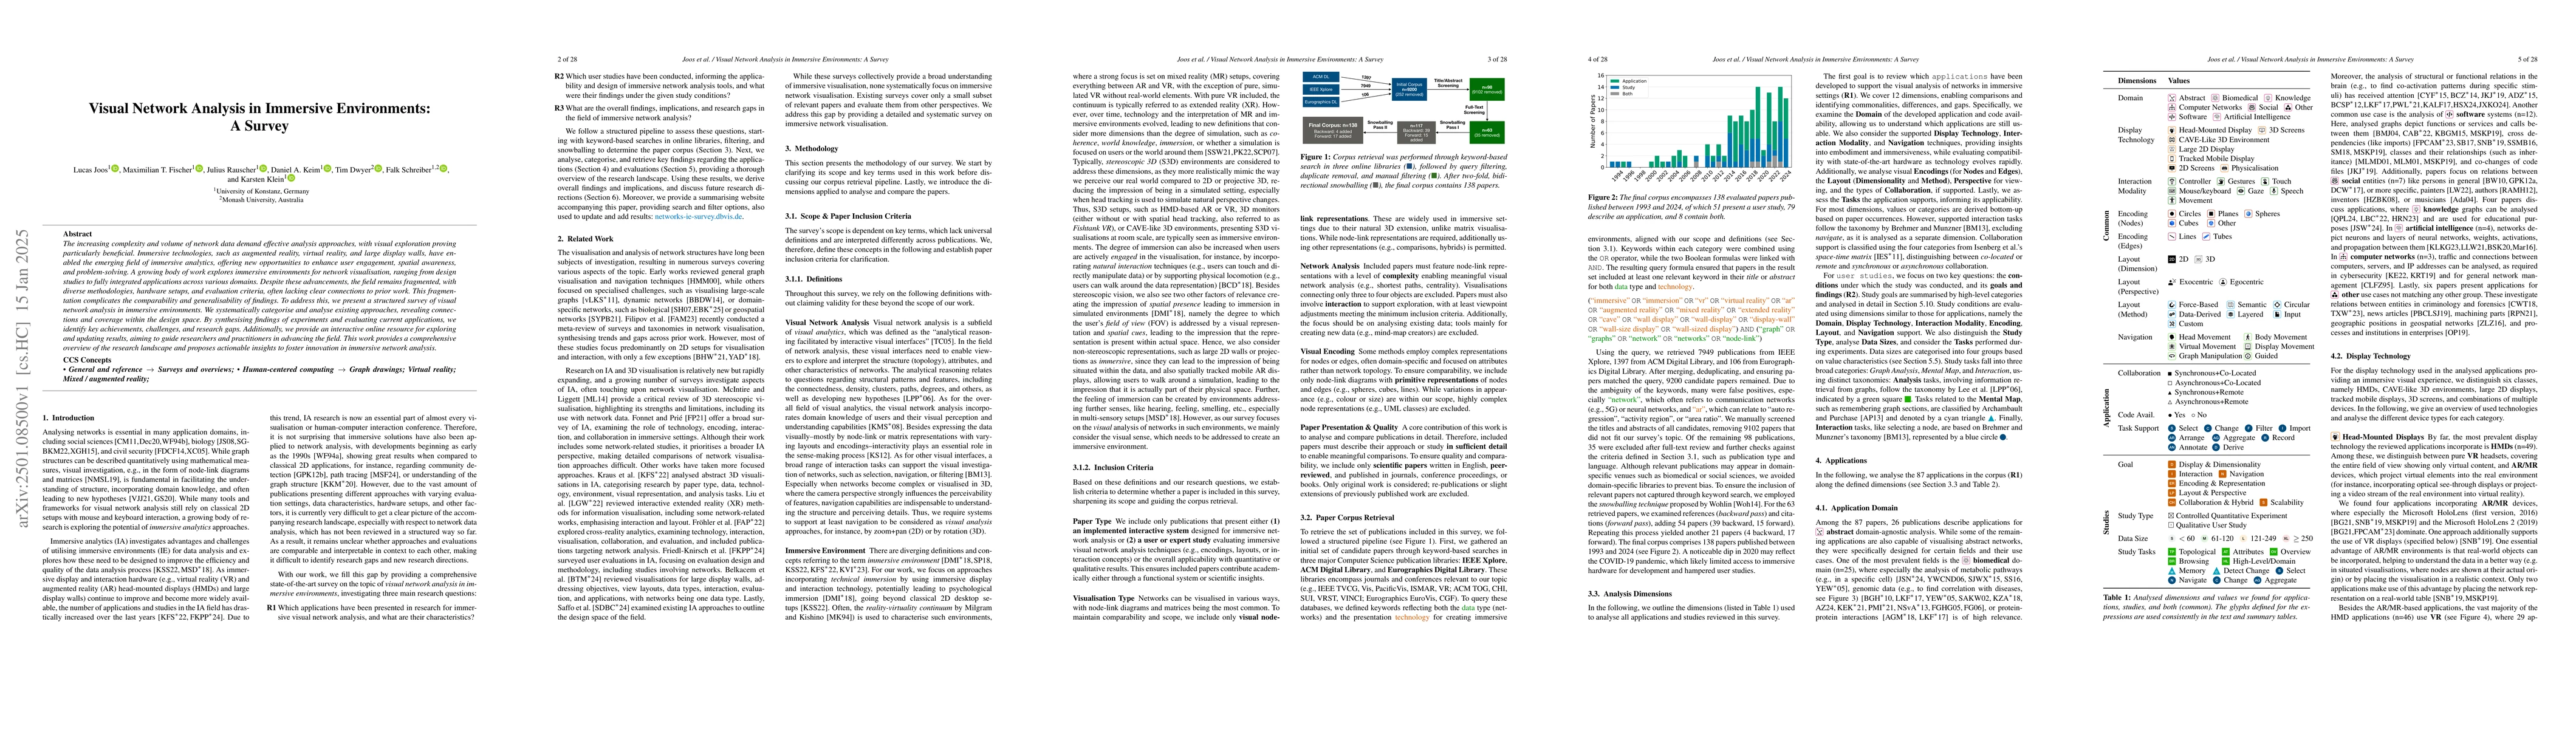
The increasing complexity and volume of network data demand effective analysis approaches, with visual exploration proving particularly beneficial. Immersive technologies, such as augmented reality, v...
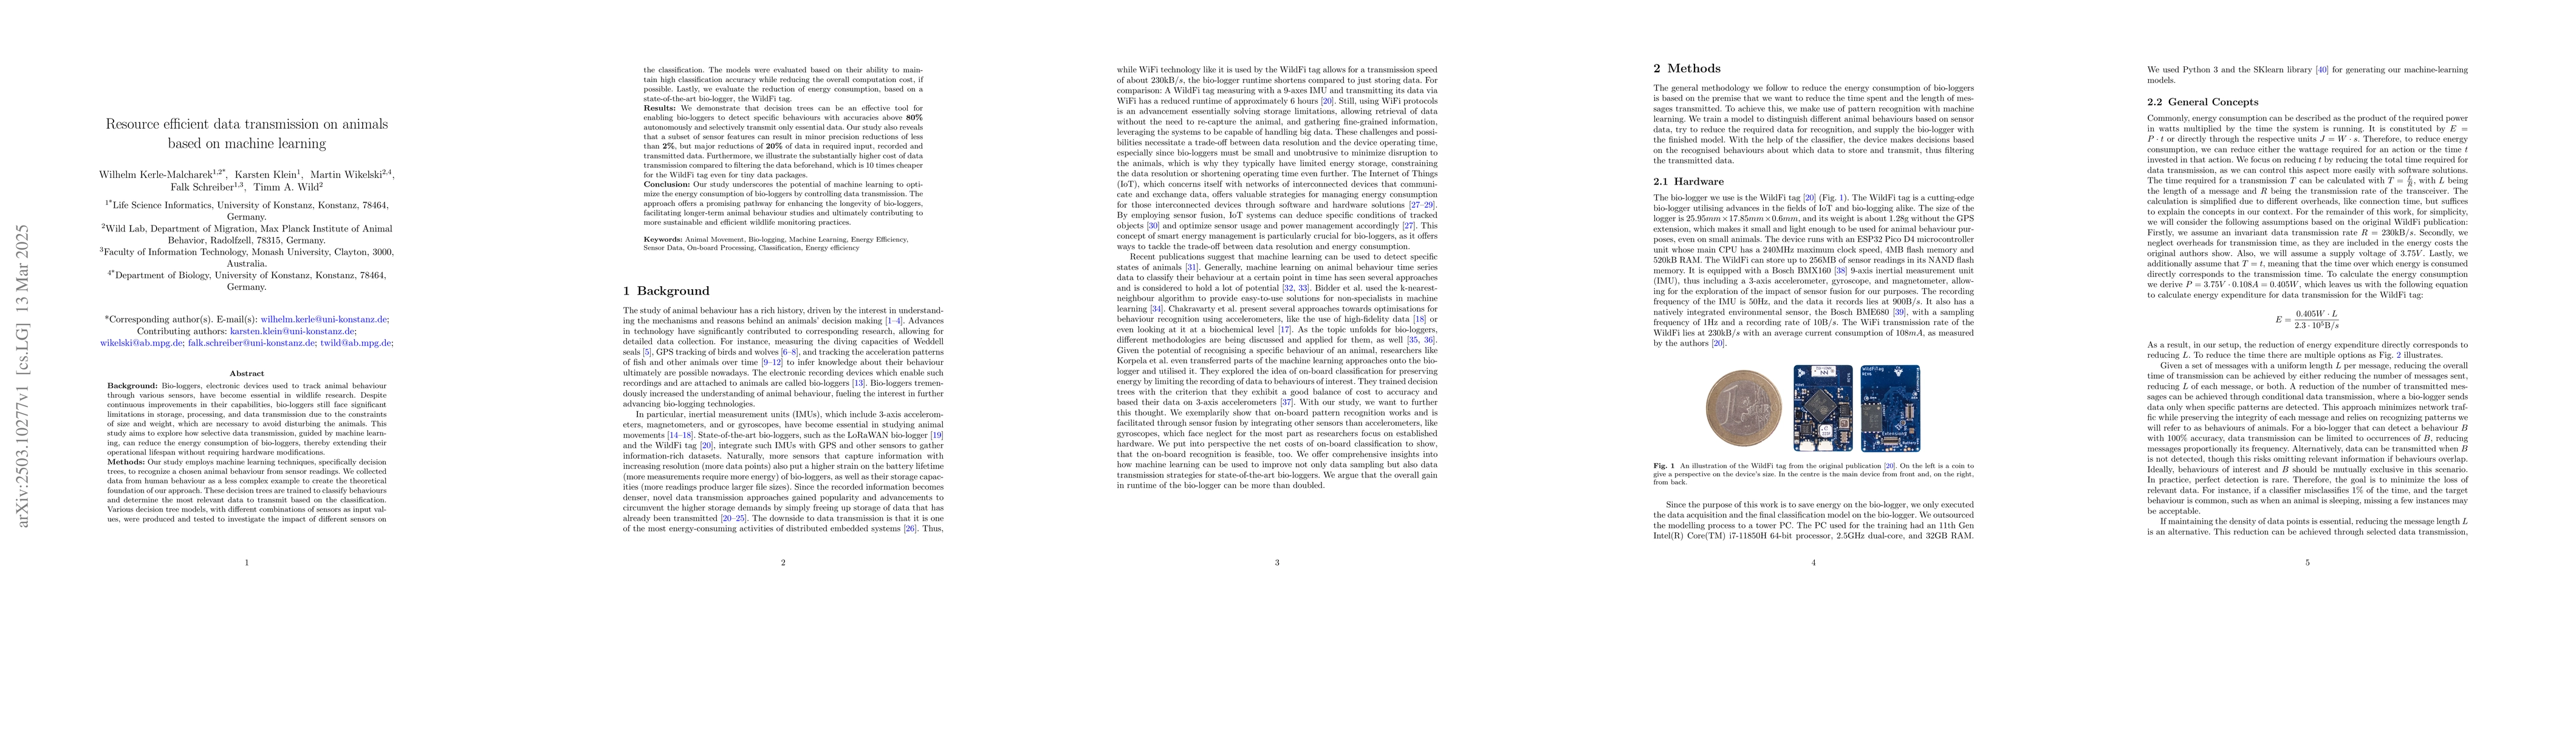
Bio-loggers, electronic devices used to track animal behaviour through various sensors, have become essential in wildlife research. Despite continuous improvements in their capabilities, bio-loggers...
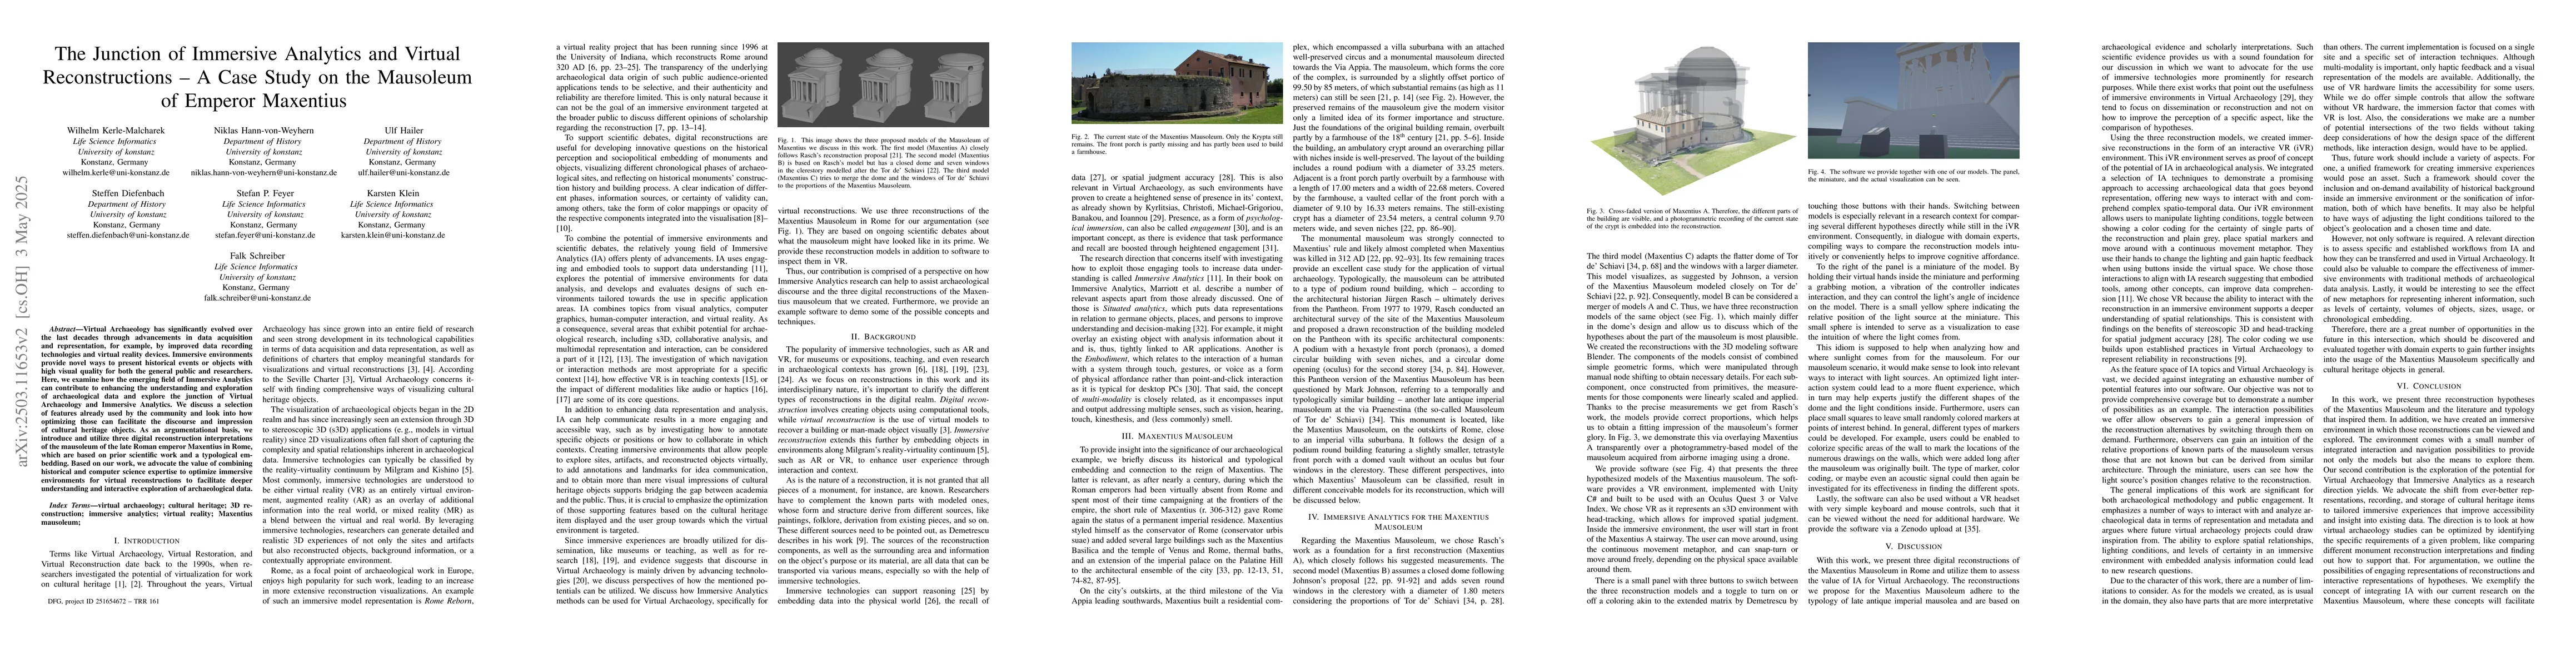
Virtual Archaeology has significantly evolved over the last decades through advancements in data acquisition and representation by, e.g., improved data recording technologies and virtual reality devic...
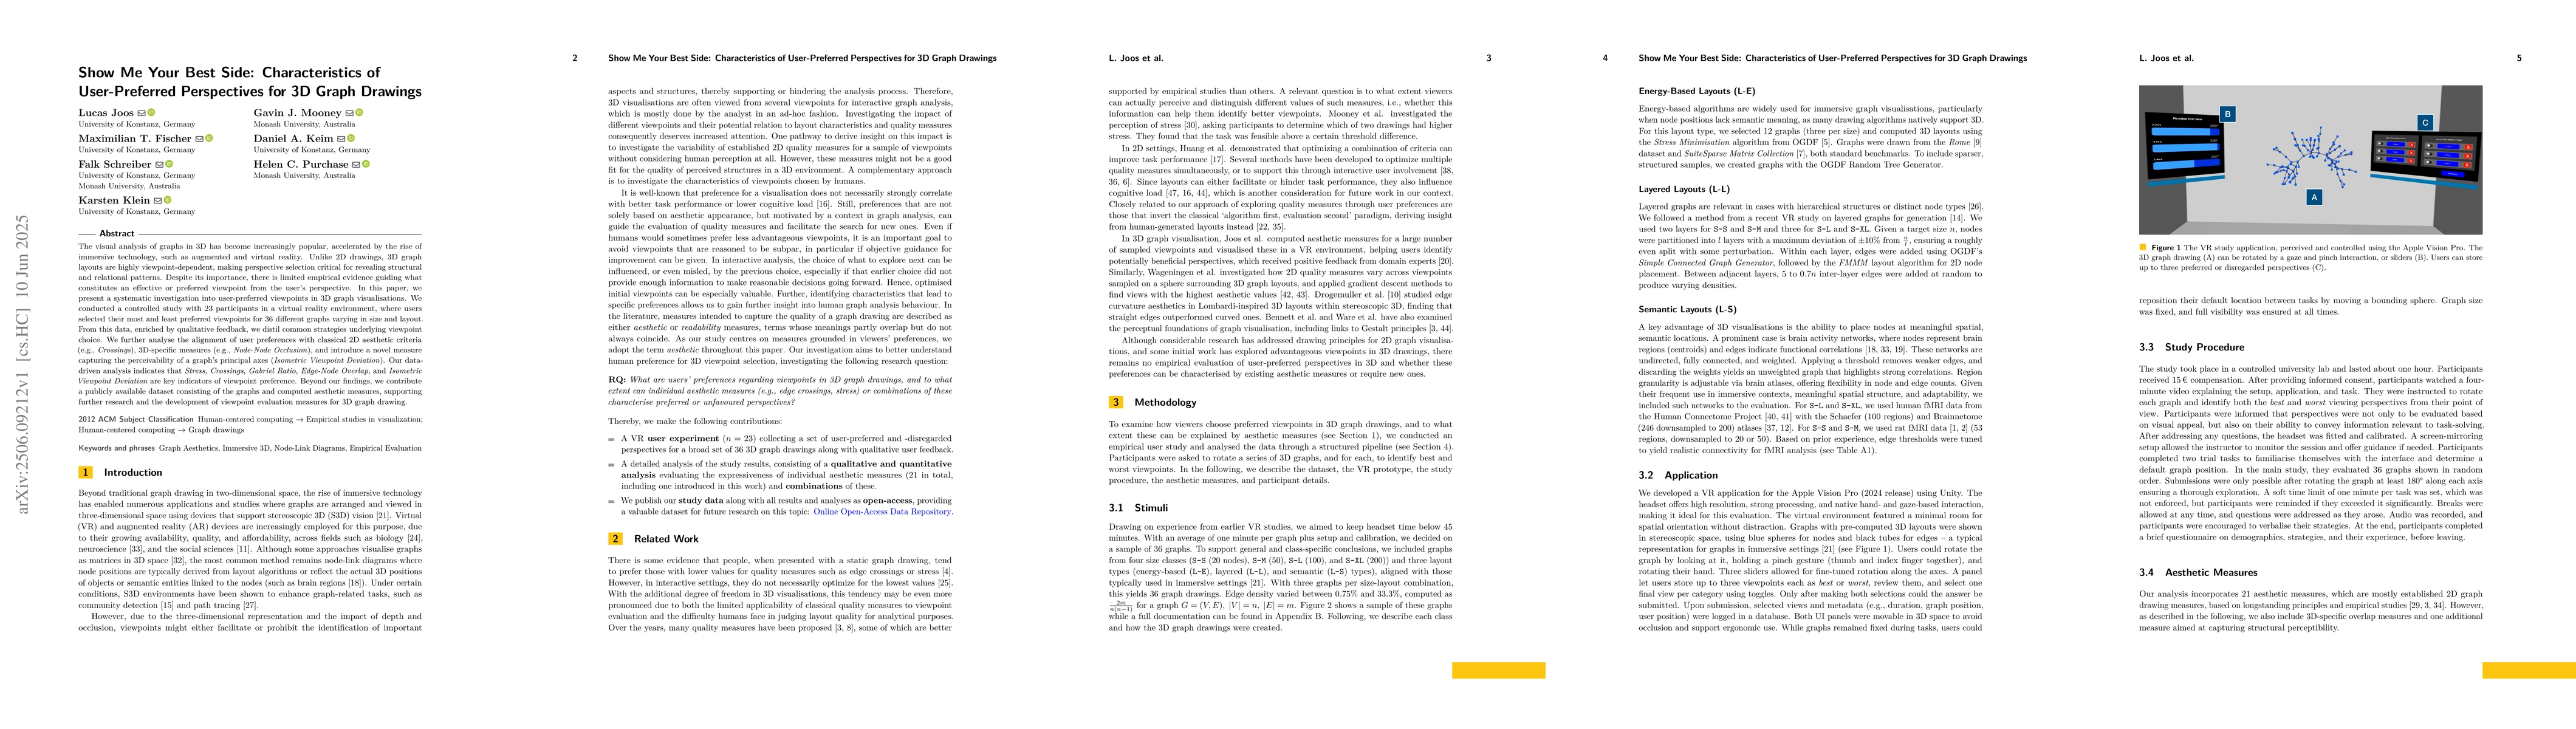
The visual analysis of graphs in 3D has become increasingly popular, accelerated by the rise of immersive technology, such as augmented and virtual reality. Unlike 2D drawings, 3D graph layouts are hi...
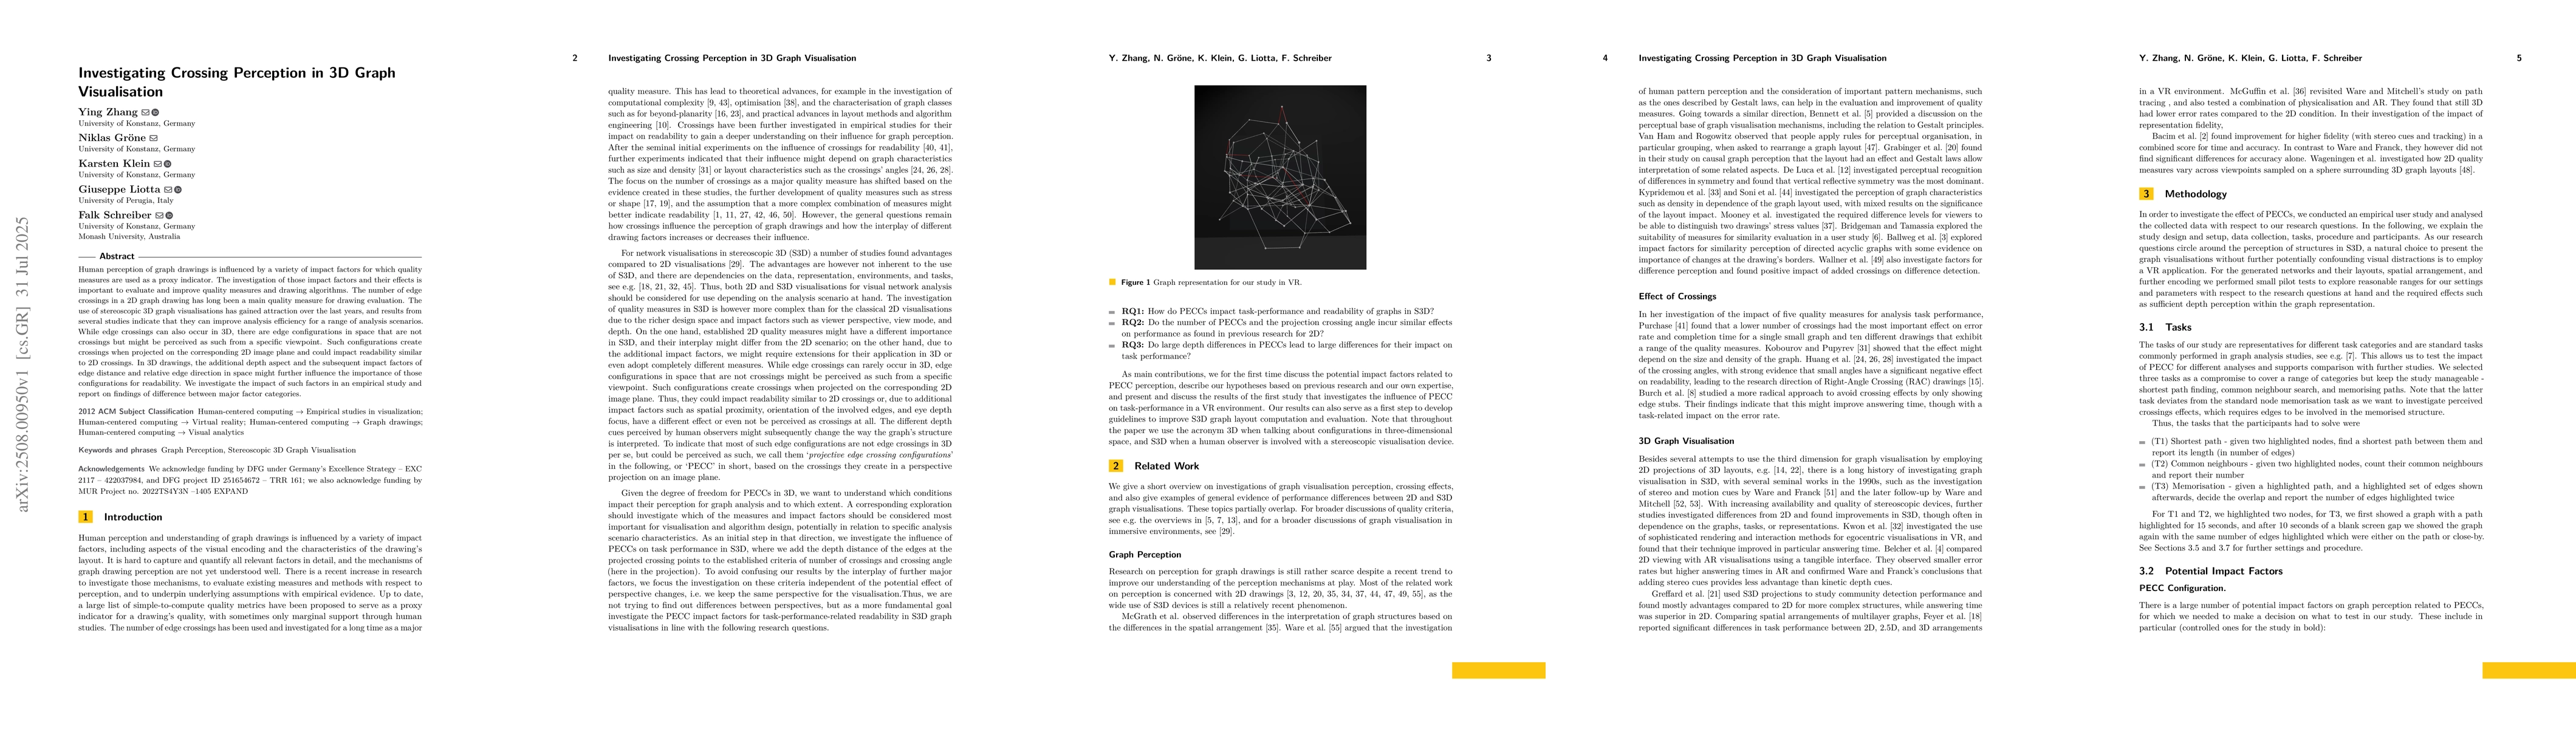
Human perception of graph drawings is influenced by a variety of impact factors for which quality measures are used as a proxy indicator. The investigation of those impact factors and their effects is...
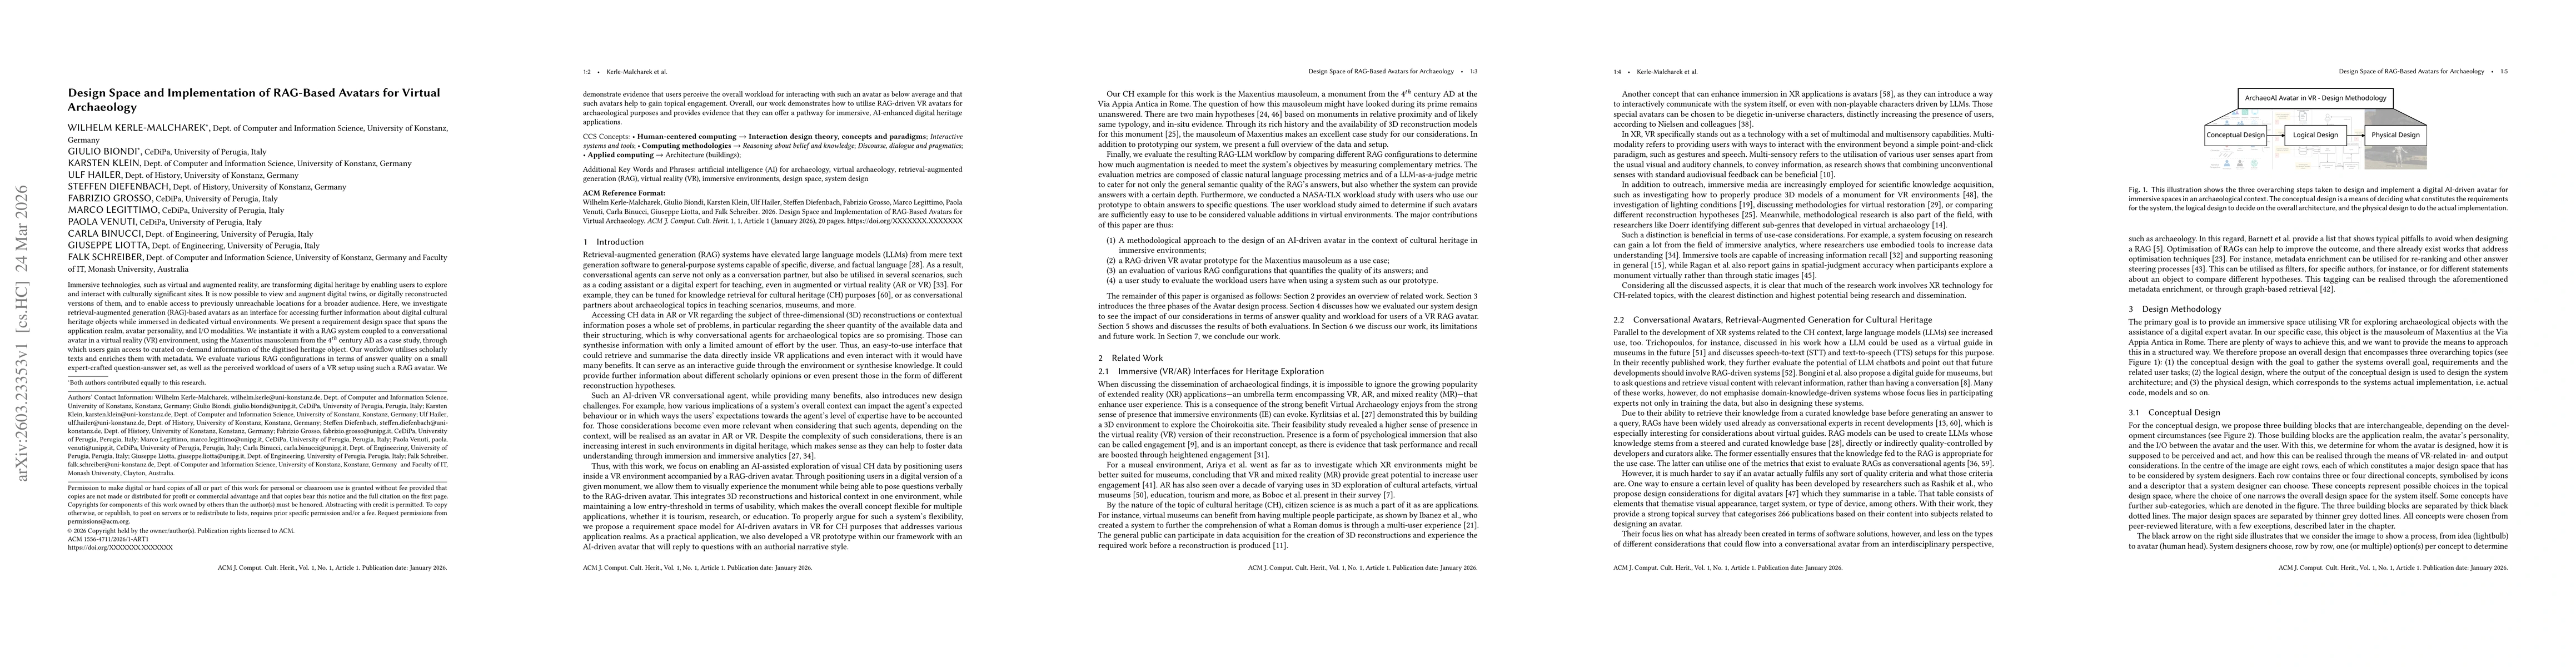
Immersive technologies, such as virtual and augmented reality, are transforming digital heritage by enabling users to explore and interact with culturally significant sites. It is now possible to view...