Help or Hinder? Evaluating the Impact of Fairness Metrics and Algorithms in Visualizations for Consensus Ranking
Publication
Metrics
AI Quick Summary
This study evaluates the effectiveness of integrating fairness metrics and algorithms into visualization systems for consensus ranking, finding that such features help users align decisions with fairness while reducing the manual effort required. The results suggest promising implications for designing next-generation fairness-oriented systems.
Paper Preview
Abstract
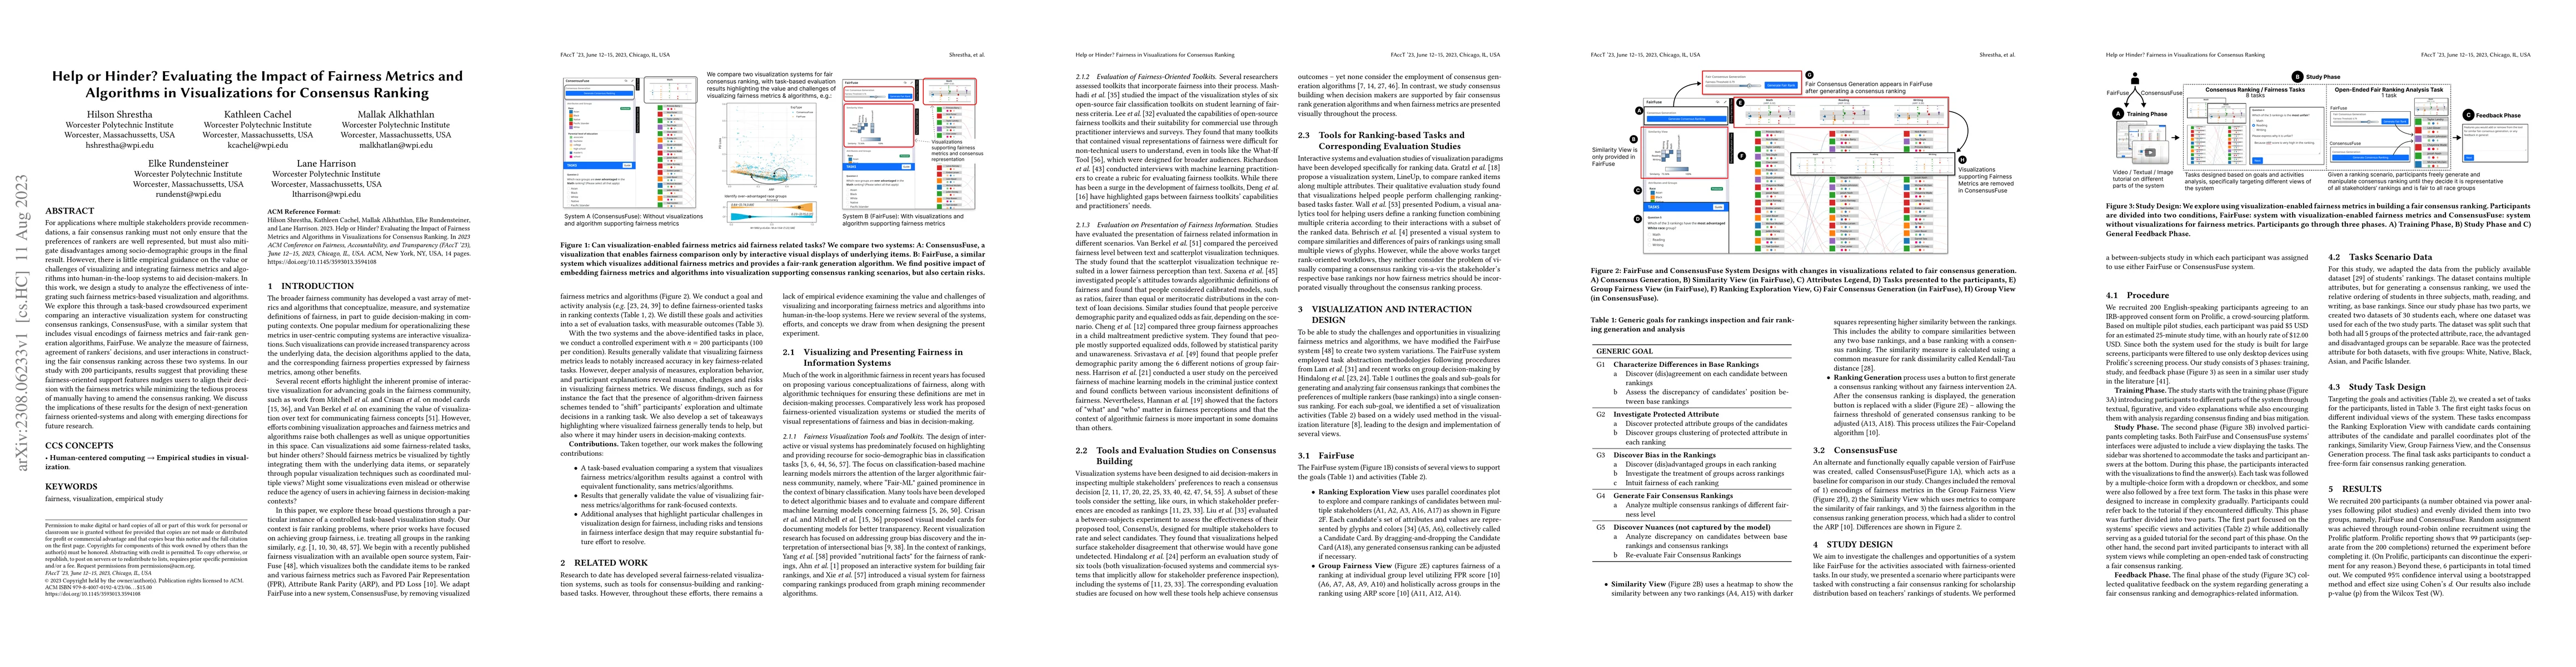
For applications where multiple stakeholders provide recommendations, a fair consensus ranking must not only ensure that the preferences of rankers are well represented, but must also mitigate disadvantages among socio-demographic groups in the final result. However, there is little empirical guidance on the value or challenges of visualizing and integrating fairness metrics and algorithms into human-in-the-loop systems to aid decision-makers. In this work, we design a study to analyze the effectiveness of integrating such fairness metrics-based visualization and algorithms. We explore this through a task-based crowdsourced experiment comparing an interactive visualization system for constructing consensus rankings, ConsensusFuse, with a similar system that includes visual encodings of fairness metrics and fair-rank generation algorithms, FairFuse. We analyze the measure of fairness, agreement of rankers' decisions, and user interactions in constructing the fair consensus ranking across these two systems. In our study with 200 participants, results suggest that providing these fairness-oriented support features nudges users to align their decision with the fairness metrics while minimizing the tedious process of manually having to amend the consensus ranking. We discuss the implications of these results for the design of next-generation fairness oriented-systems and along with emerging directions for future research.
AI Key Findings
Get AI-generated insights about this paper's methodology, results, significance, and more — seven facets brought into focus.
Impact
Paper Details
Authors
PDF Preview
Key Terms
Citation Network
Current paper (gray), citations (green), references (blue)
Display is limited for performance on very large graphs.
Discussion 0