Lane Harrison

12 papers on arXiv

Academic Profile

Name: M. Harrison
Total Papers: 3

Statistics

arXiv Papers 12
Total Publications 3

Papers on arXiv

Thumbnail for Adaptive Assessment of Visualization Literacy

Adaptive Assessment of Visualization Literacy

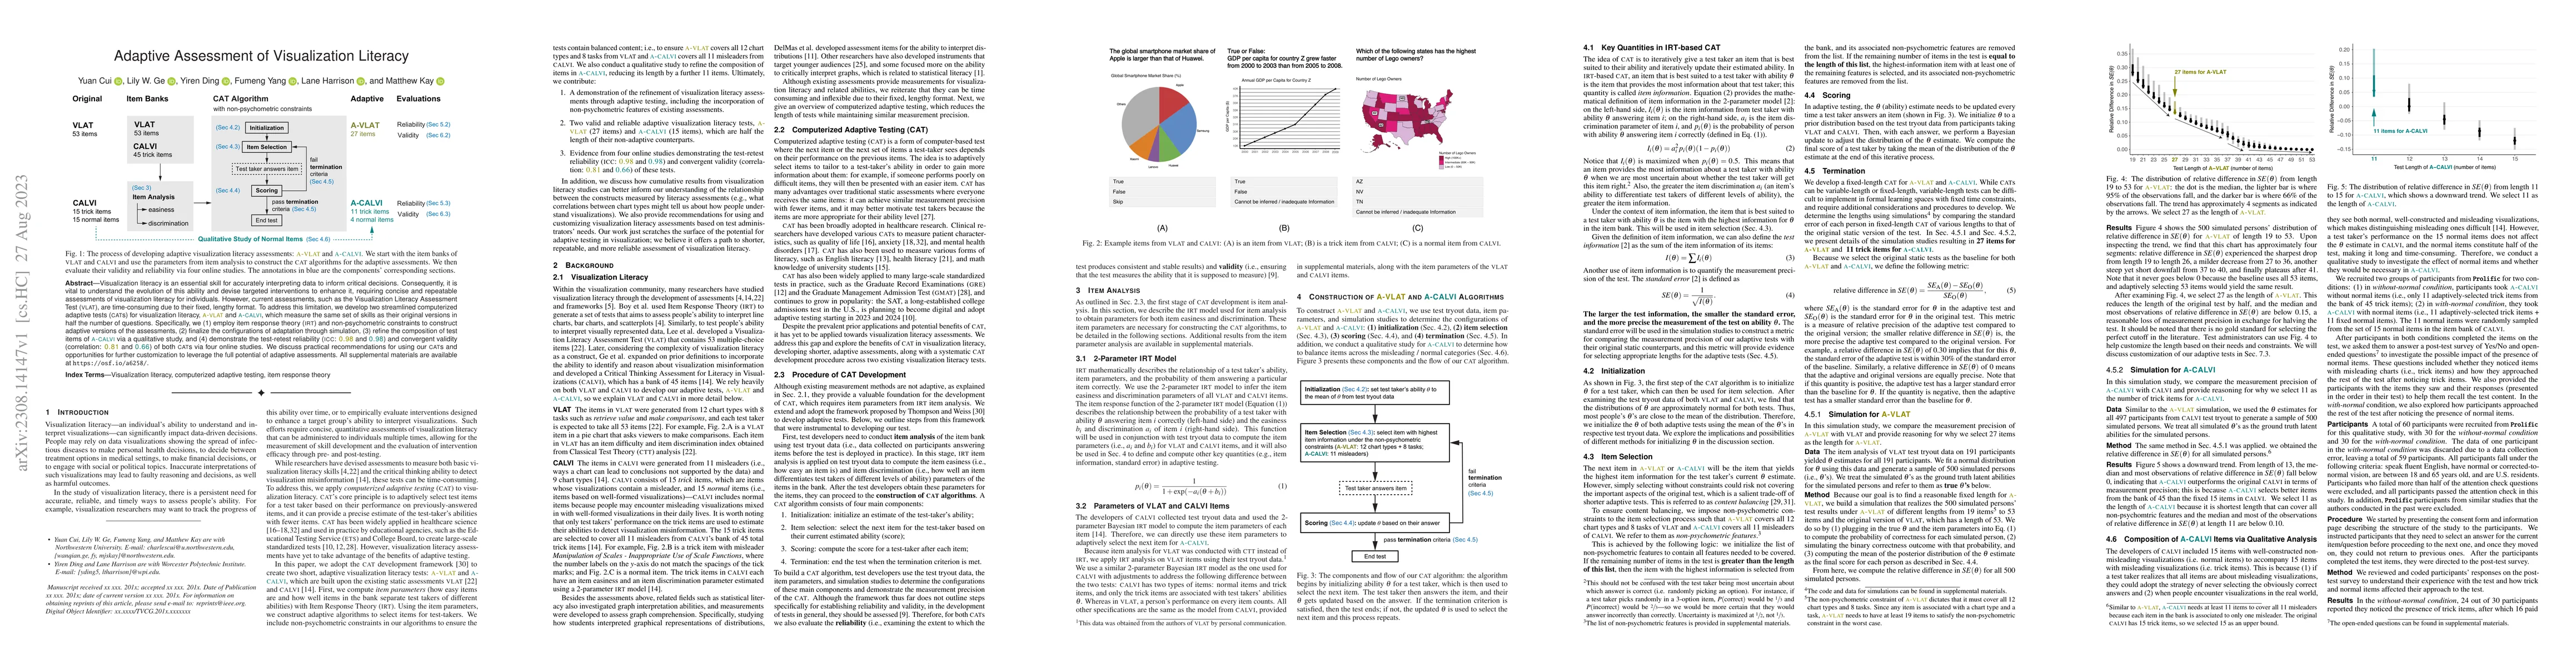
Visualization literacy is an essential skill for accurately interpreting data to inform critical decisions. Consequently, it is vital to understand the evolution of this ability and devise targeted ...

Thumbnail for Help or Hinder? Evaluating the Impact of Fairness Metrics and Algorithms
  in Visualizations for Consensus Ranking

Help or Hinder? Evaluating the Impact of Fairness Metrics and Algorithms in Visualizations for Consensus Ranking

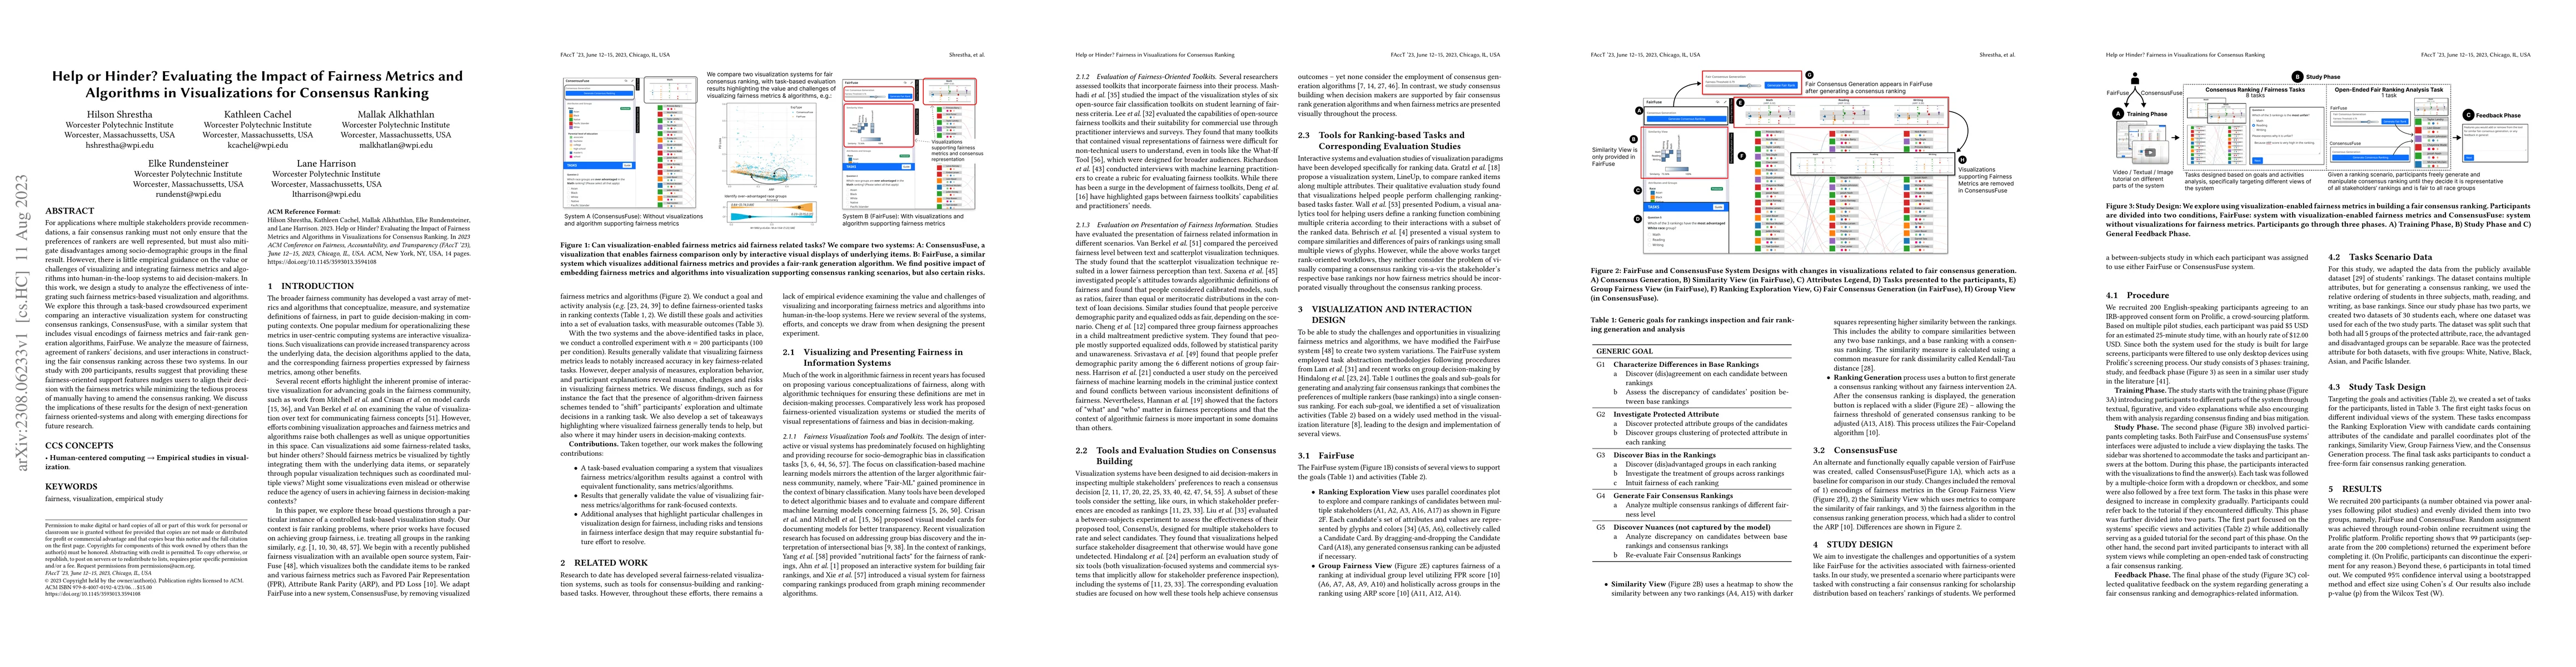
For applications where multiple stakeholders provide recommendations, a fair consensus ranking must not only ensure that the preferences of rankers are well represented, but must also mitigate disad...

Thumbnail for The Risks of Ranking: Revisiting Graphical Perception to Model
  Individual Differences in Visualization Performance

The Risks of Ranking: Revisiting Graphical Perception to Model Individual Differences in Visualization Performance

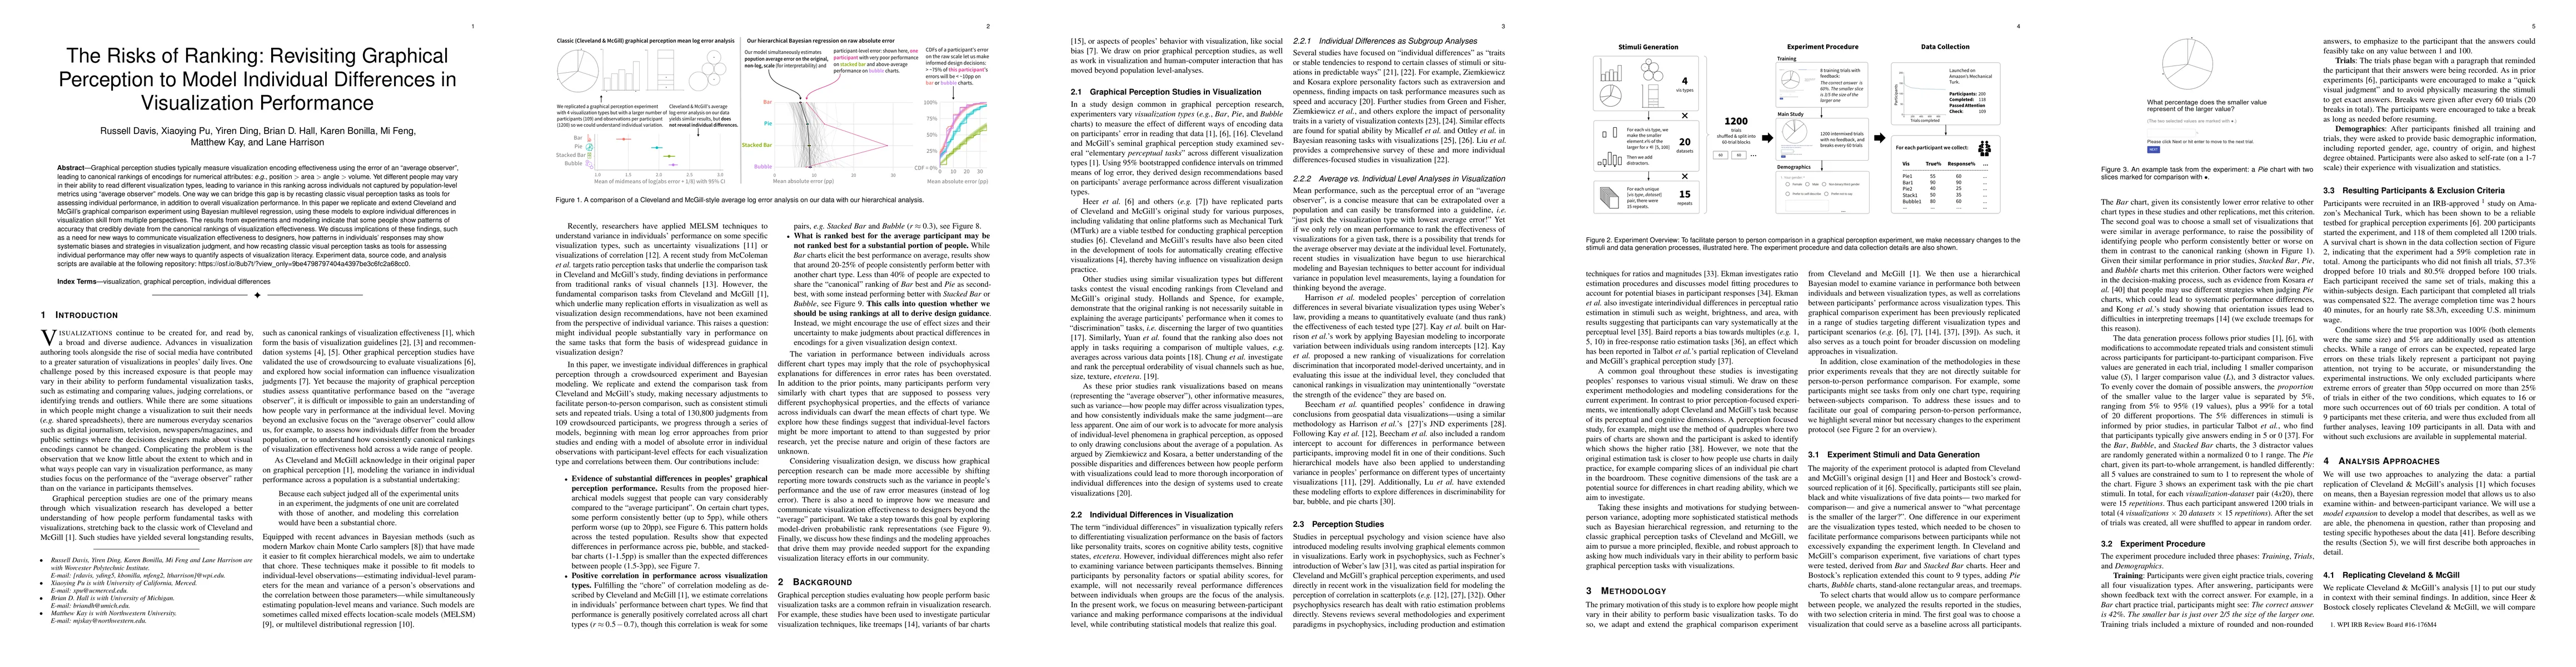
Graphical perception studies typically measure visualization encoding effectiveness using the error of an "average observer", leading to canonical rankings of encodings for numerical attributes: e.g...

Thumbnail for MANI-Rank: Multiple Attribute and Intersectional Group Fairness for
  Consensus Ranking

MANI-Rank: Multiple Attribute and Intersectional Group Fairness for Consensus Ranking

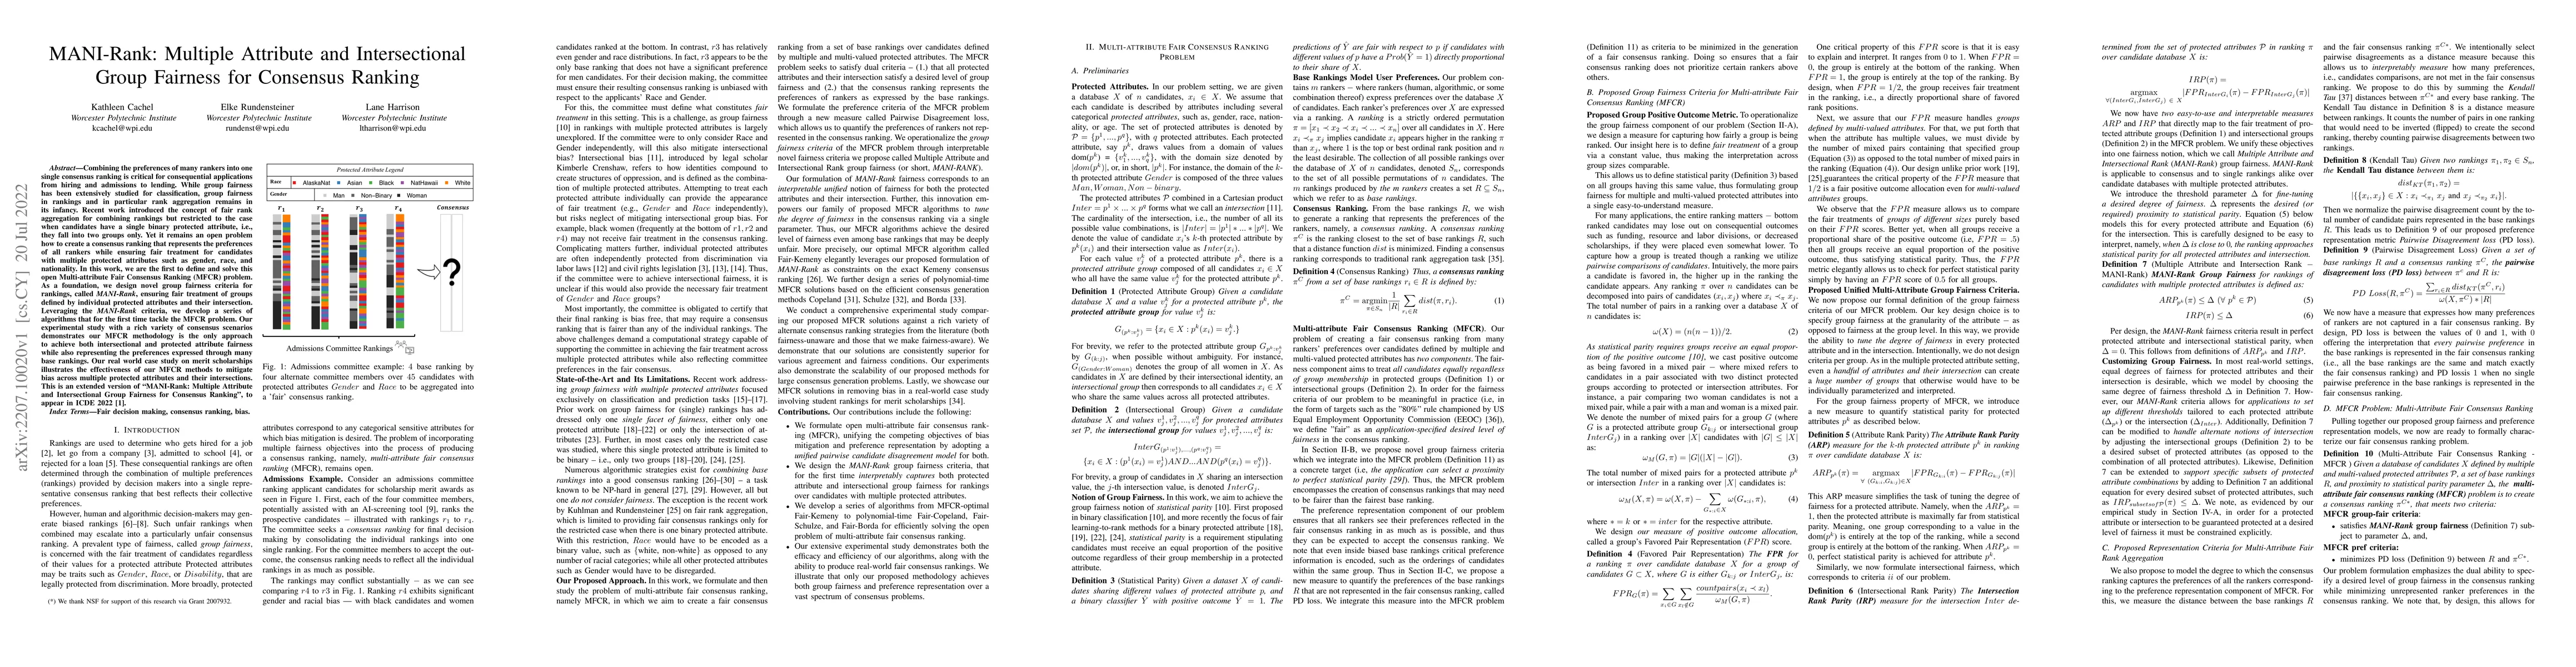
Combining the preferences of many rankers into one single consensus ranking is critical for consequential applications from hiring and admissions to lending. While group fairness has been extensivel...

Thumbnail for Probablement, Wahrscheinlich, Likely ? A Cross-Language Study of How
  People Verbalize Probabilities in Icon Array Visualizations

Probablement, Wahrscheinlich, Likely ? A Cross-Language Study of How People Verbalize Probabilities in Icon Array Visualizations

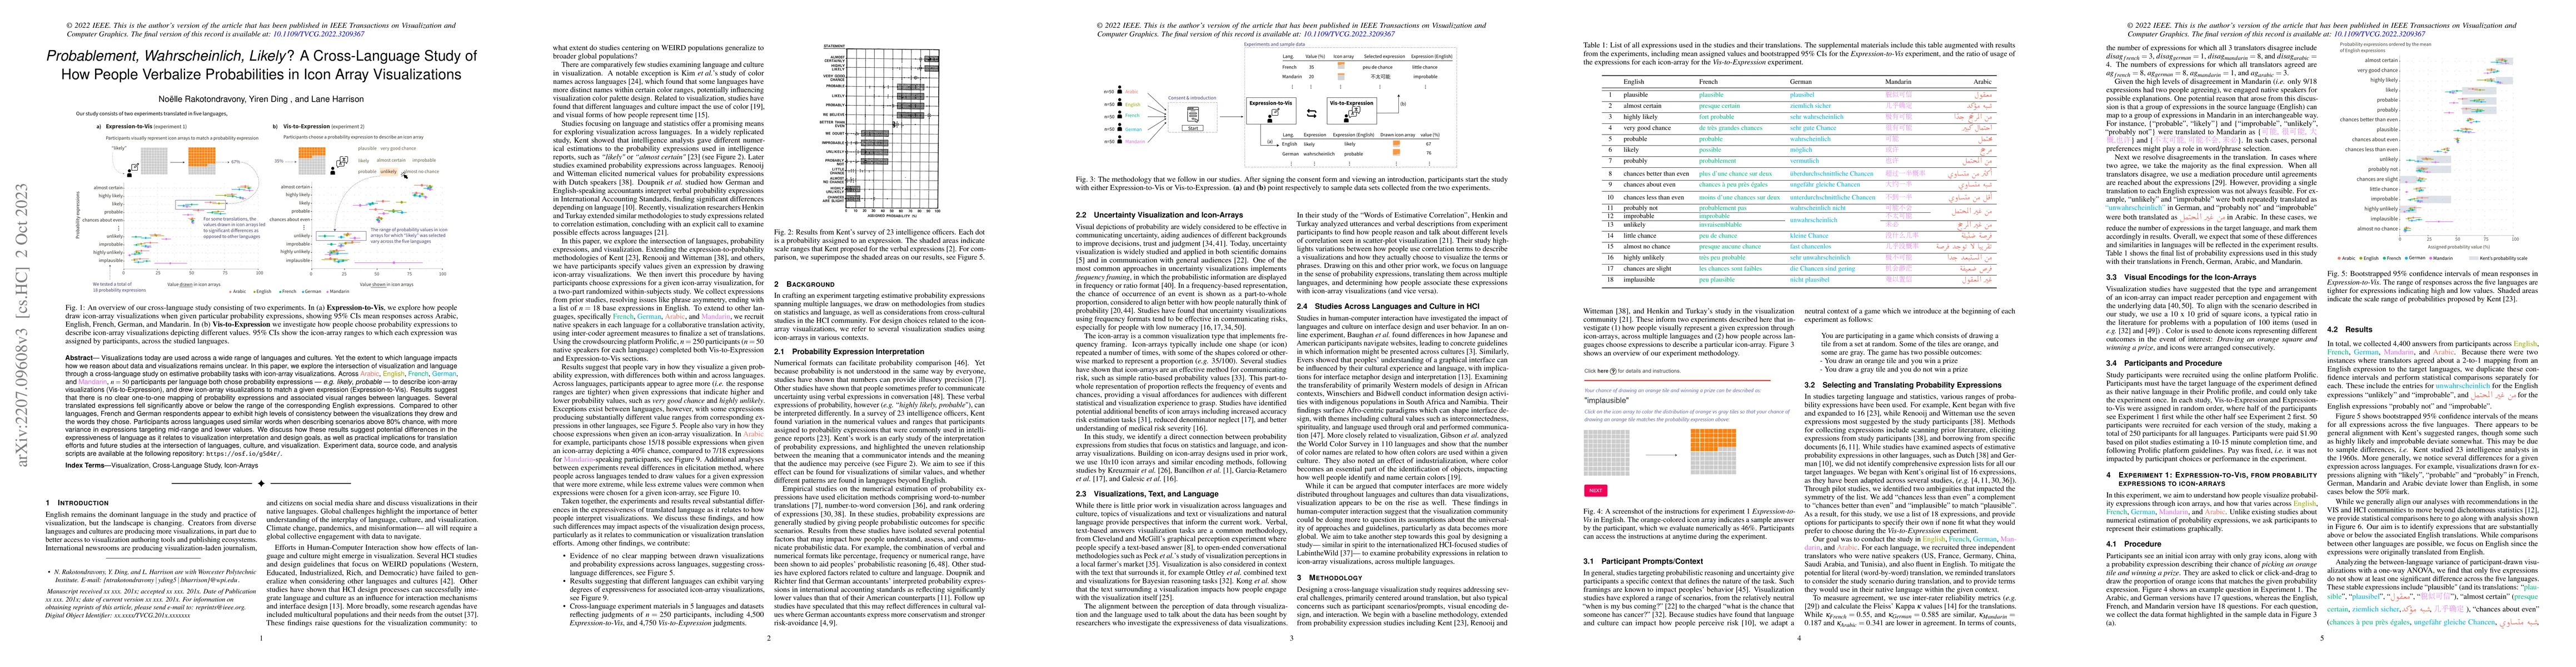
Visualizations today are used across a wide range of languages and cultures. Yet the extent to which language impacts how we reason about data and visualizations remains unclear. In this paper, we e...

Thumbnail for VisQuiz: Exploring Feedback Mechanisms to Improve Graphical Perception

VisQuiz: Exploring Feedback Mechanisms to Improve Graphical Perception

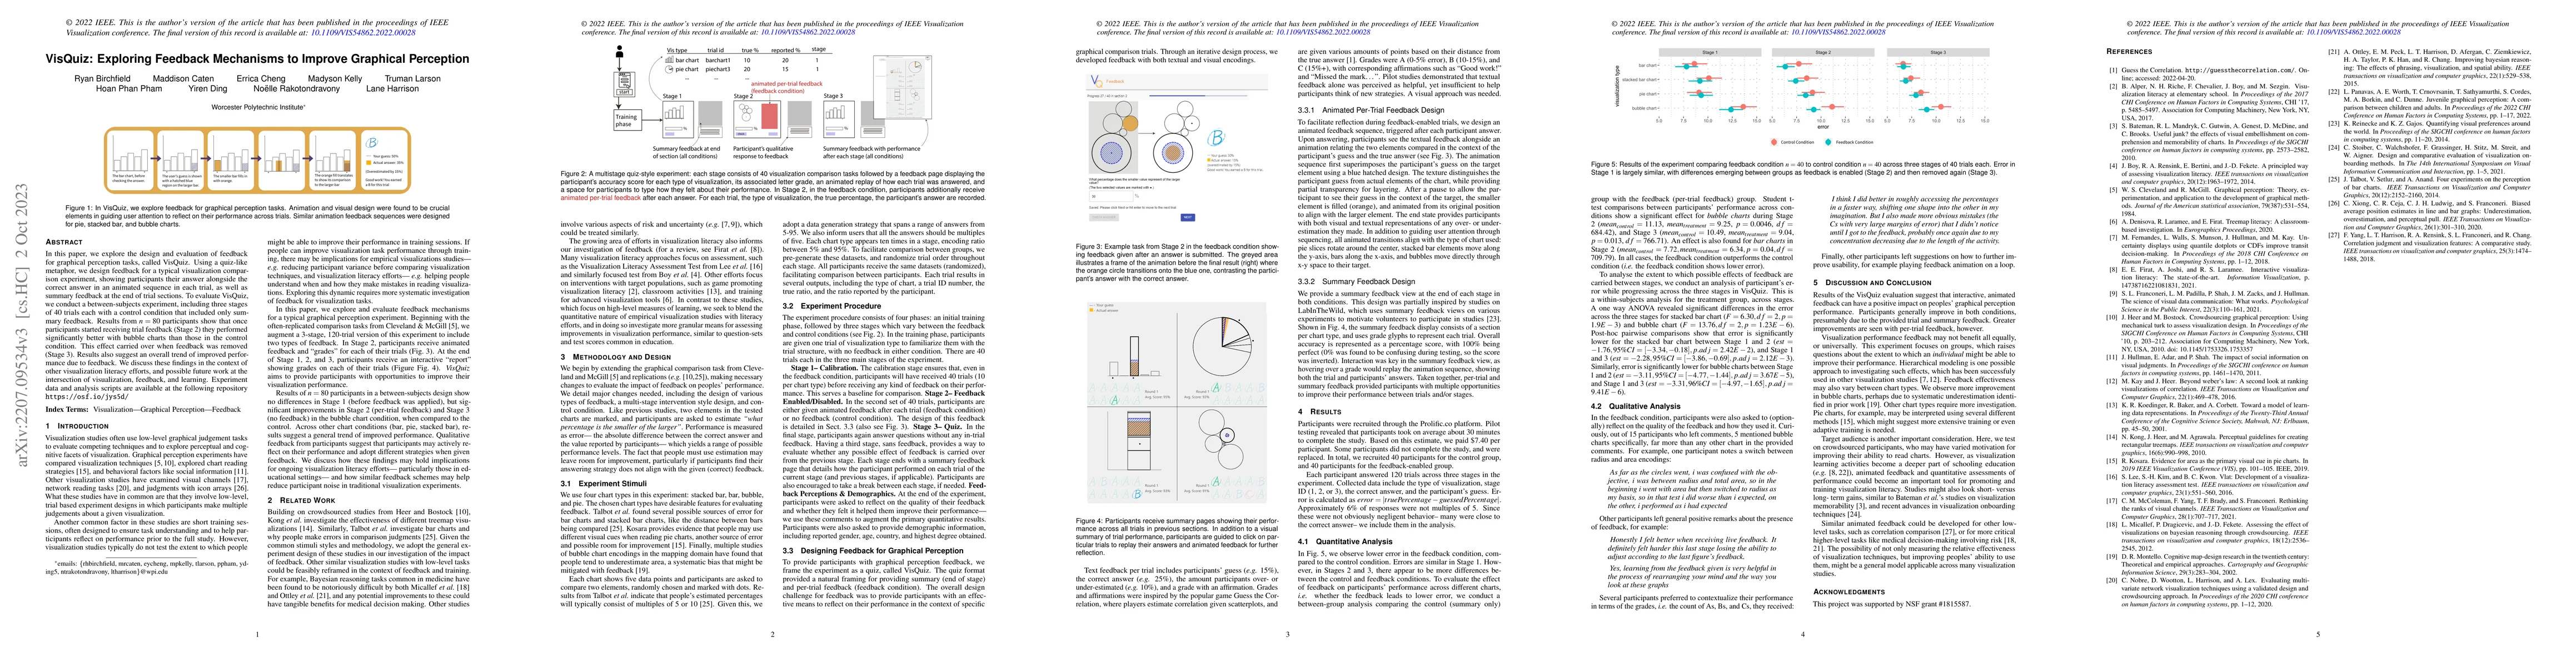
Graphical perception studies are a key element of visualization research, forming the basis of design recommendations and contributing to our understanding of how people make sense of visualizations...

Thumbnail for FairFuse: Interactive Visual Support for Fair Consensus Ranking

FairFuse: Interactive Visual Support for Fair Consensus Ranking

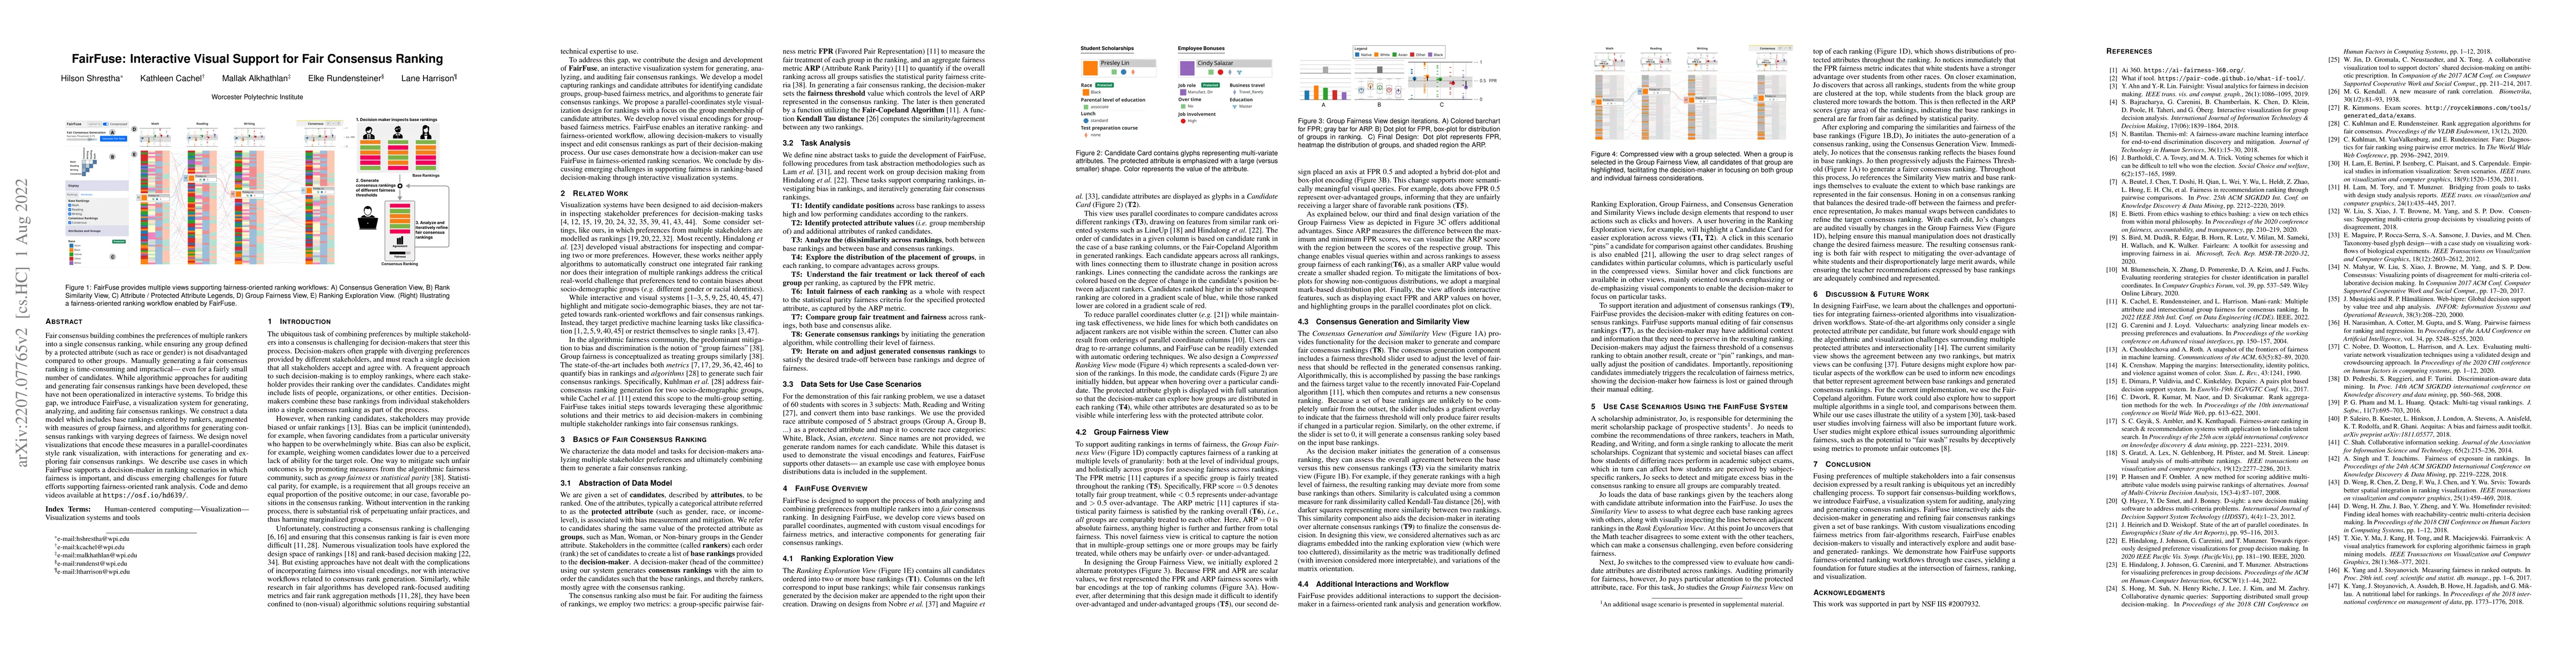
Fair consensus building combines the preferences of multiple rankers into a single consensus ranking, while ensuring any group defined by a protected attribute (such as race or gender) is not disadv...

Thumbnail for "They Aren't Built For Me": A Replication Study of Visual Graphical
  Perception with Tactile Representations of Data for Visually Impaired Users

"They Aren't Built For Me": A Replication Study of Visual Graphical Perception with Tactile Representations of Data for Visually Impaired Users

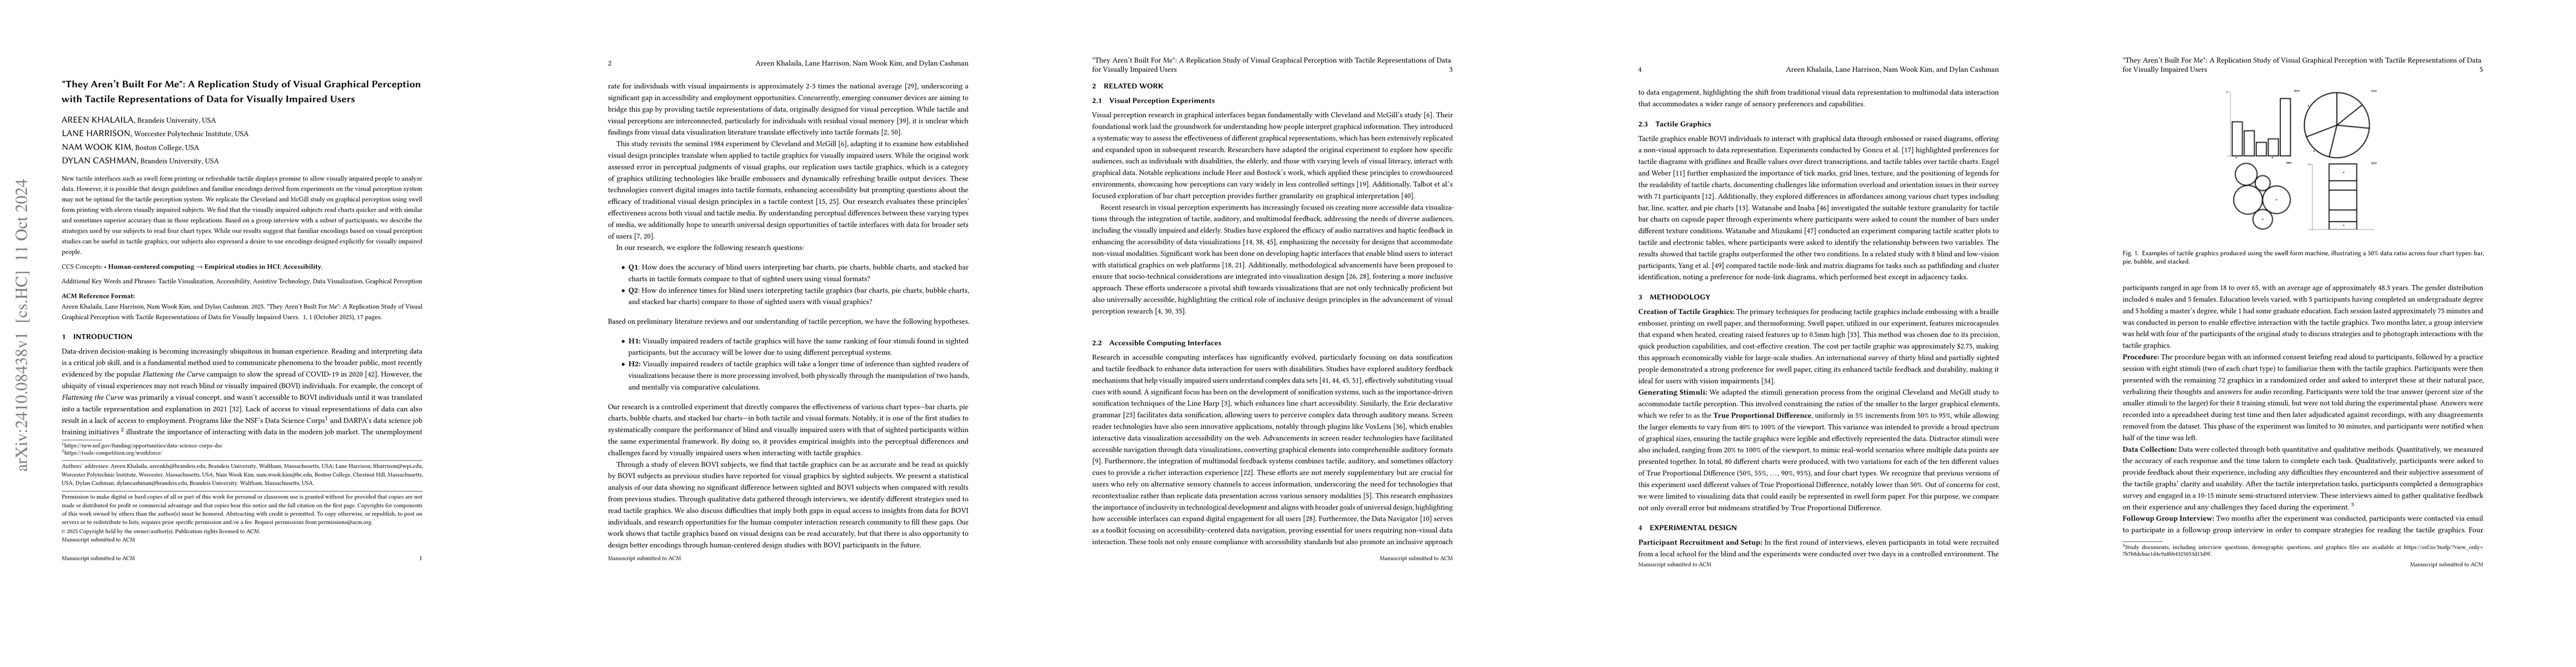
New tactile interfaces such as swell form printing or refreshable tactile displays promise to allow visually impaired people to analyze data. However, it is possible that design guidelines and familia...

Thumbnail for ReVISit 2: A Full Experiment Life Cycle User Study Framework

ReVISit 2: A Full Experiment Life Cycle User Study Framework

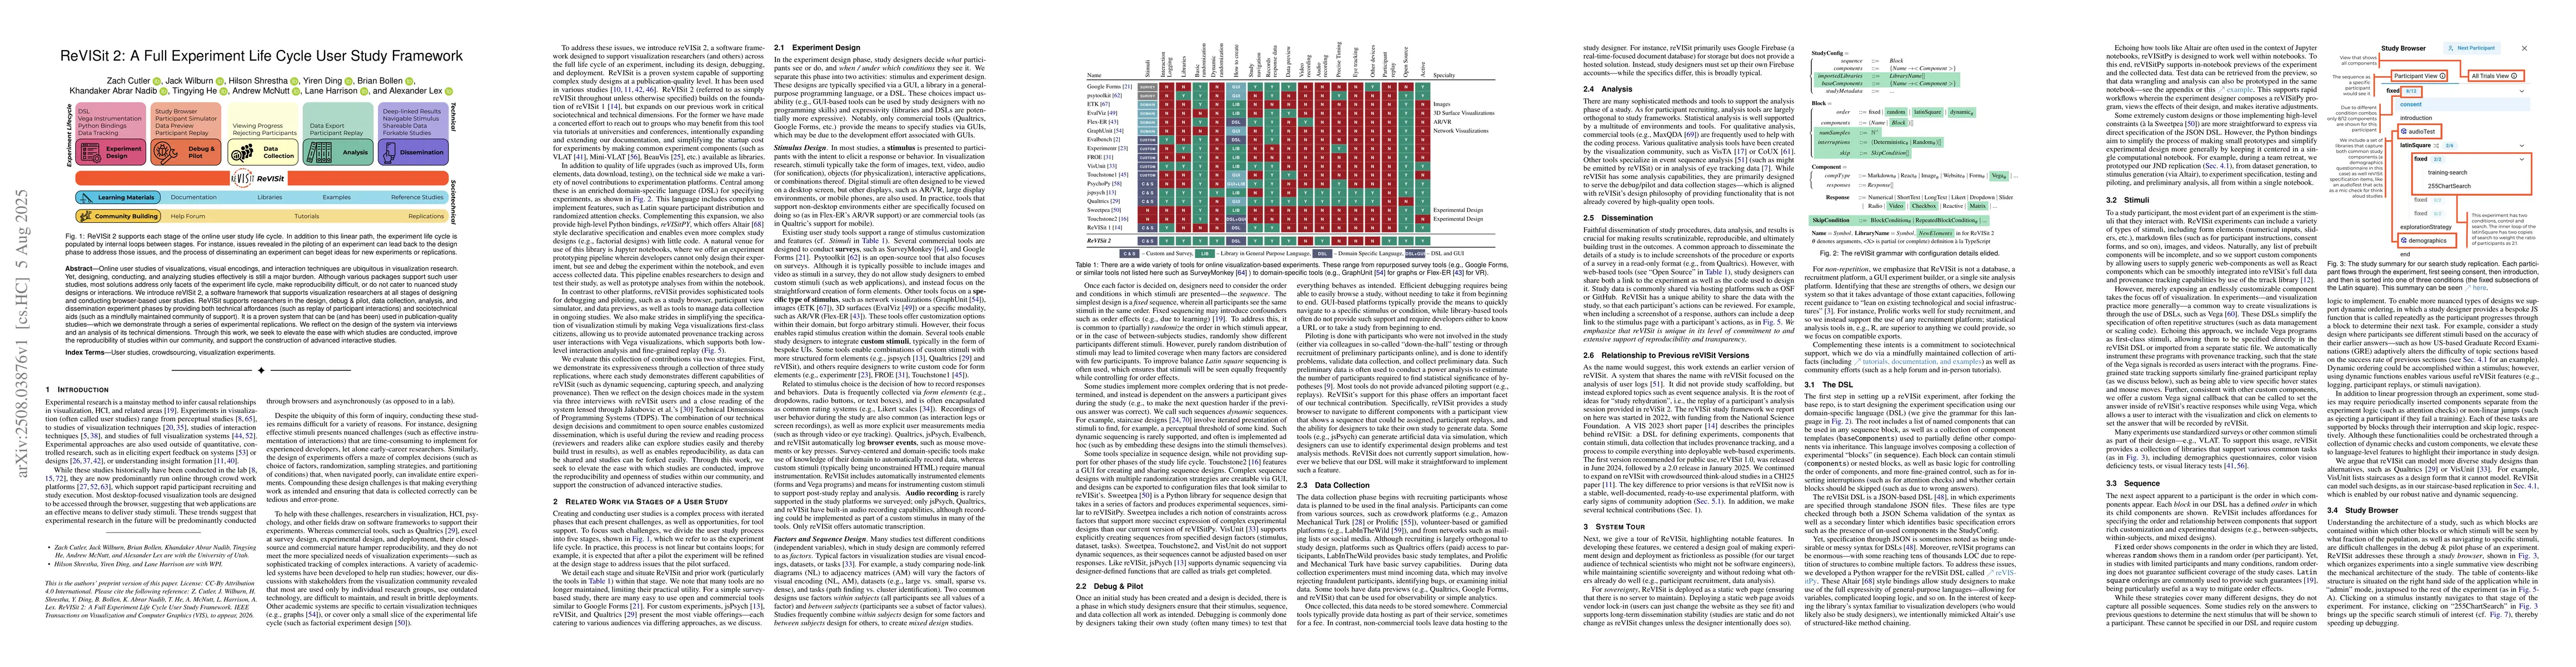
Online user studies of visualizations, visual encodings, and interaction techniques are ubiquitous in visualization research. Yet, designing, conducting, and analyzing studies effectively is still a m...

Thumbnail for "They Aren't Built For Me": An Exploratory Study of Strategies for
  Measurement of Graphical Primitives in Tactile Graphics

"They Aren't Built For Me": An Exploratory Study of Strategies for Measurement of Graphical Primitives in Tactile Graphics

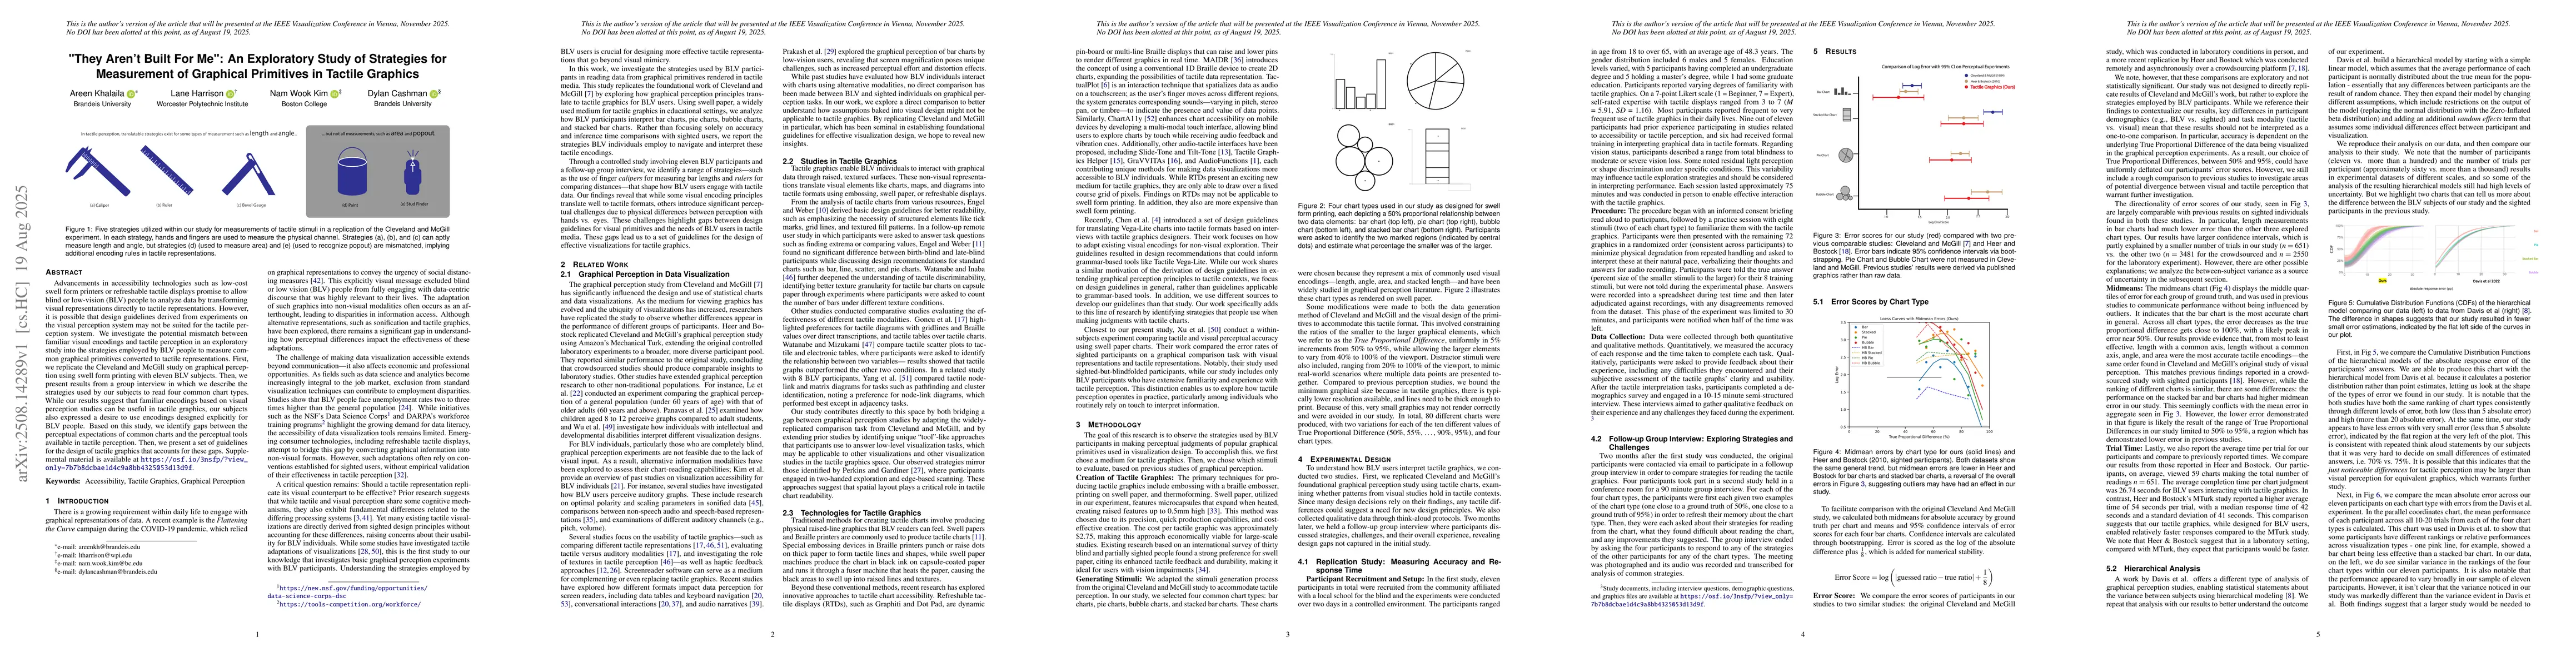
Advancements in accessibility technologies such as low-cost swell form printers or refreshable tactile displays promise to allow blind or low-vision (BLV) people to analyze data by transforming visual...

Thumbnail for The State of the Art in Visualization Literacy

The State of the Art in Visualization Literacy

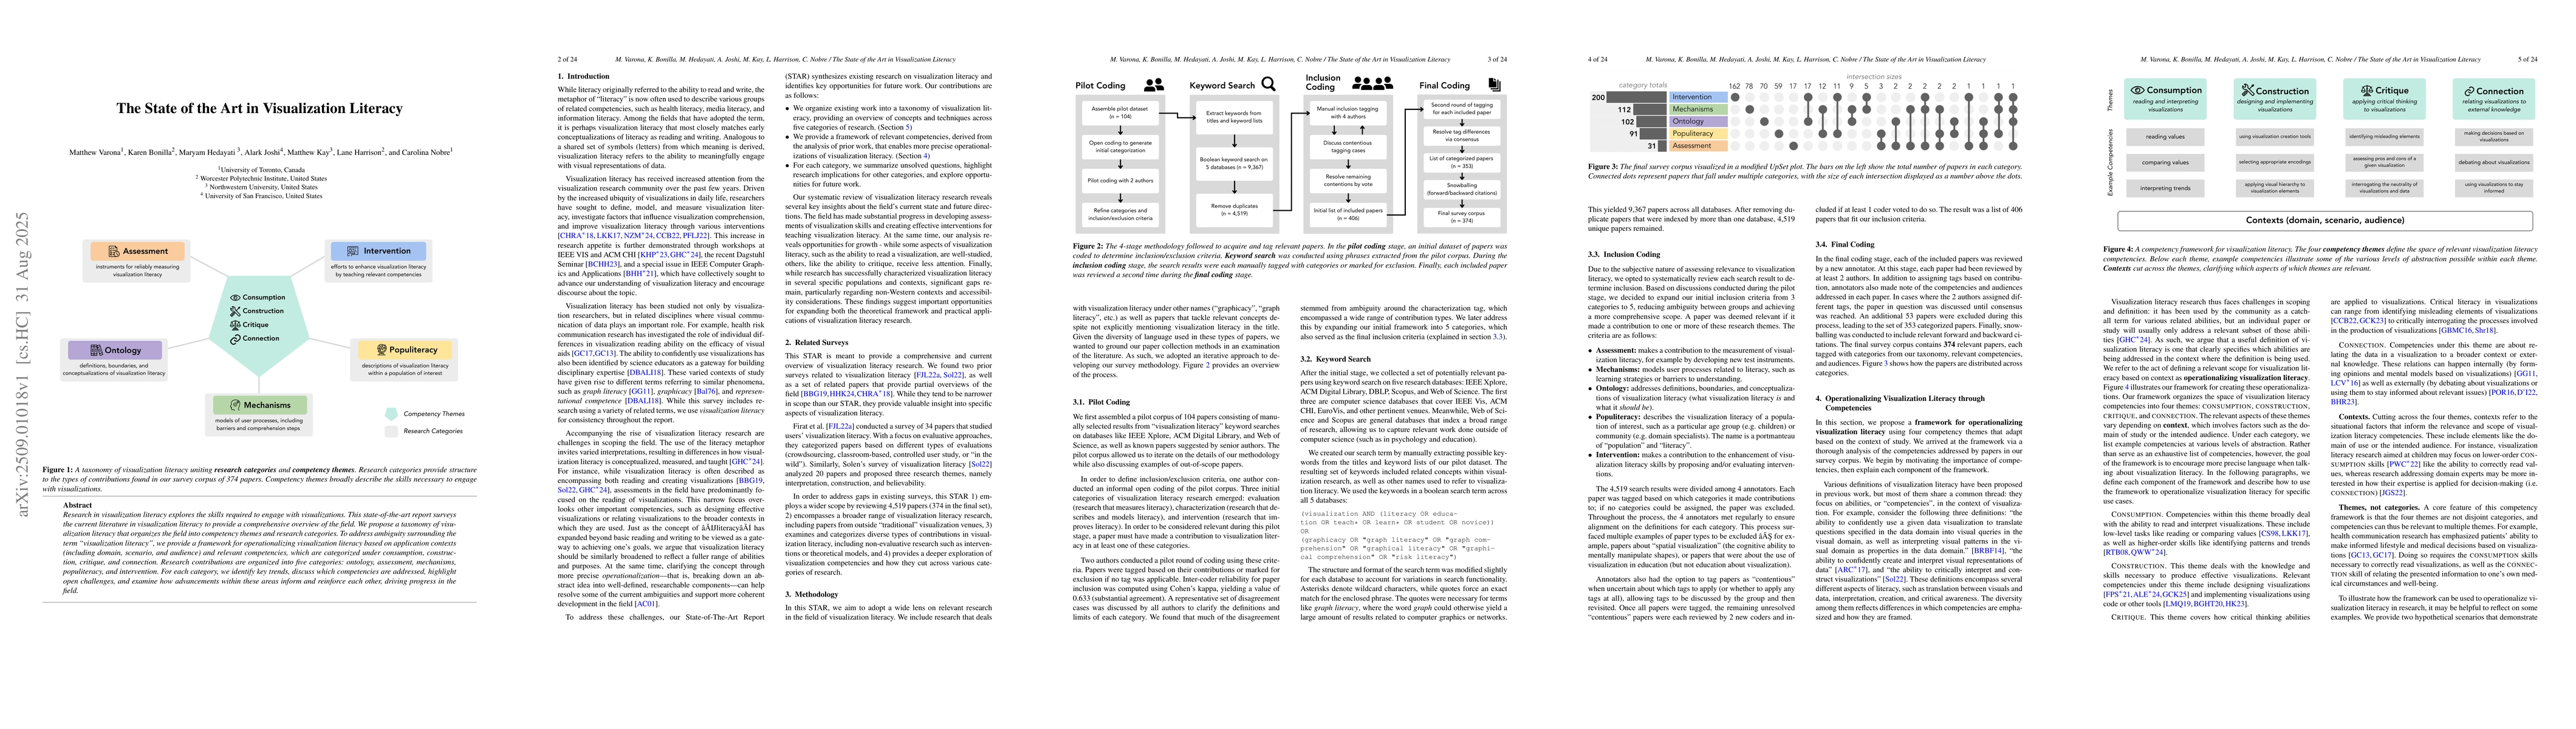
Research in visualization literacy explores the skills required to engage with visualizations. This state-of-the-art report surveys the current literature in visualization literacy to provide a compre...

Thumbnail for A Priest, a Rabbi, and an Atheist Walk Into an Error Bar: Religious
  Meditations on Uncertainty Visualization

A Priest, a Rabbi, and an Atheist Walk Into an Error Bar: Religious Meditations on Uncertainty Visualization

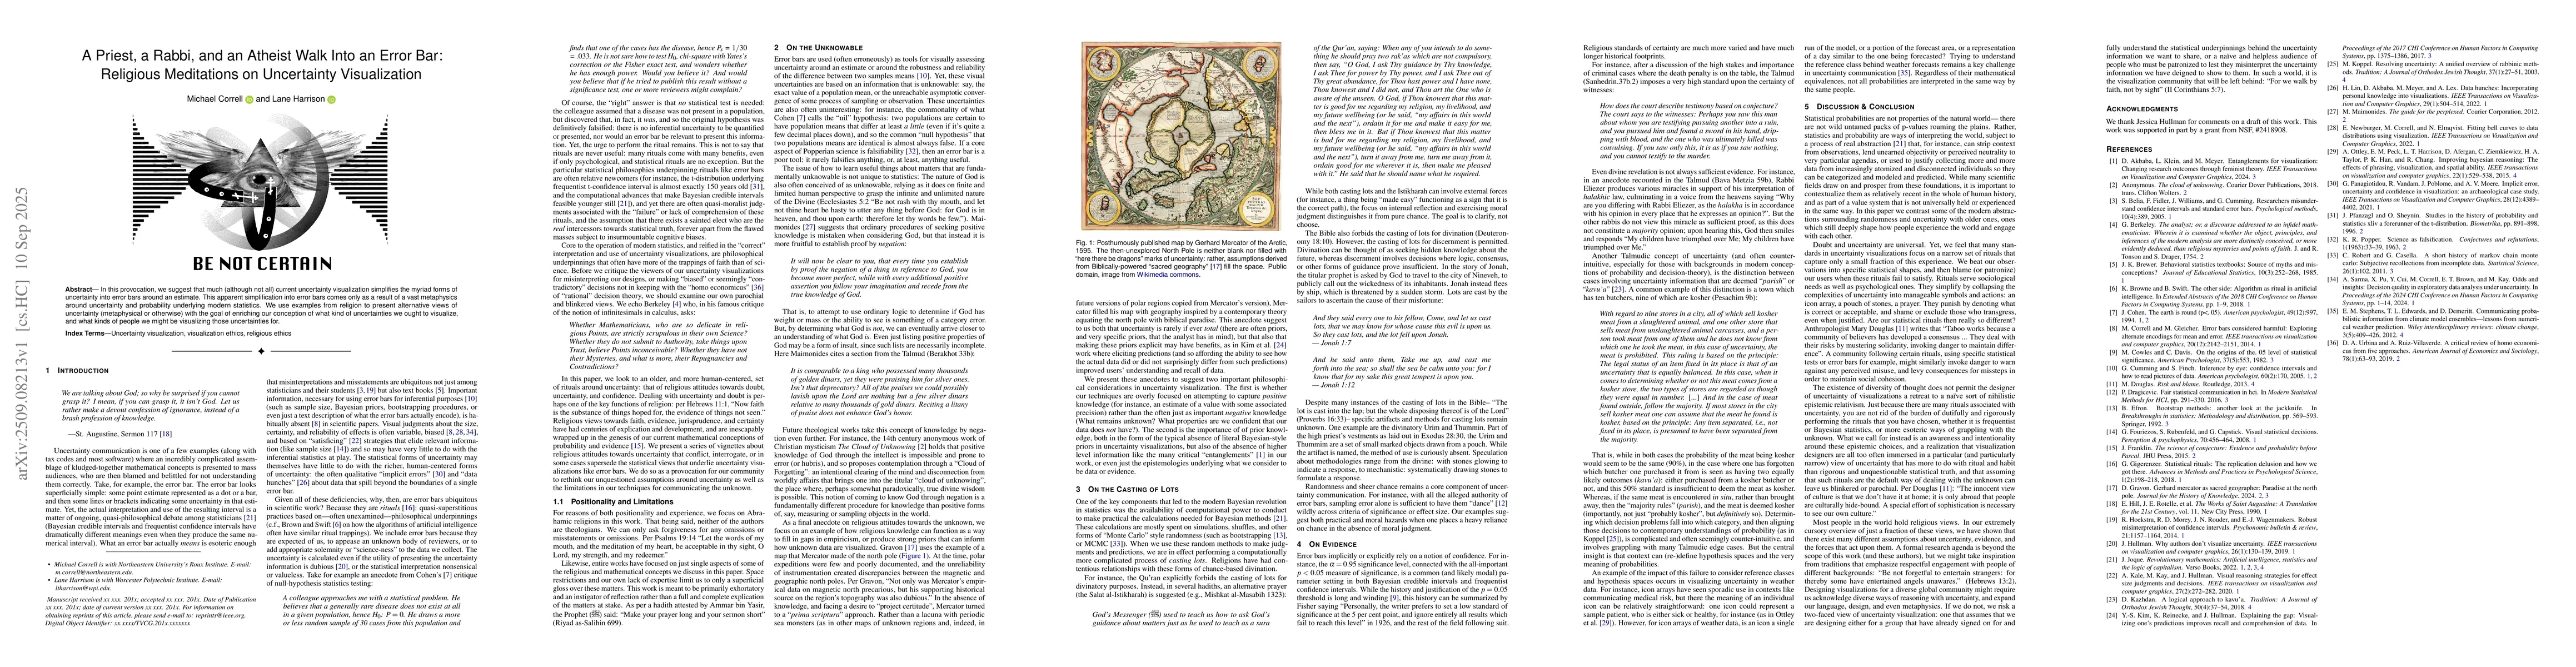
In this provocation, we suggest that much (although not all) current uncertainty visualization simplifies the myriad forms of uncertainty into error bars around an estimate. This apparent simplificati...

This website uses cookies to ensure you get the best experience. Learn more