VisQuiz: Exploring Feedback Mechanisms to Improve Graphical Perception
Publication
Metrics
AI Quick Summary
This paper explores the design and evaluation of VisQuiz, a feedback mechanism for improving graphical perception in visualization tasks. Results from an experiment with 80 participants show that providing trial-level feedback significantly enhances performance with bubble charts, with effects persisting even after feedback is removed.
Paper Preview
Abstract
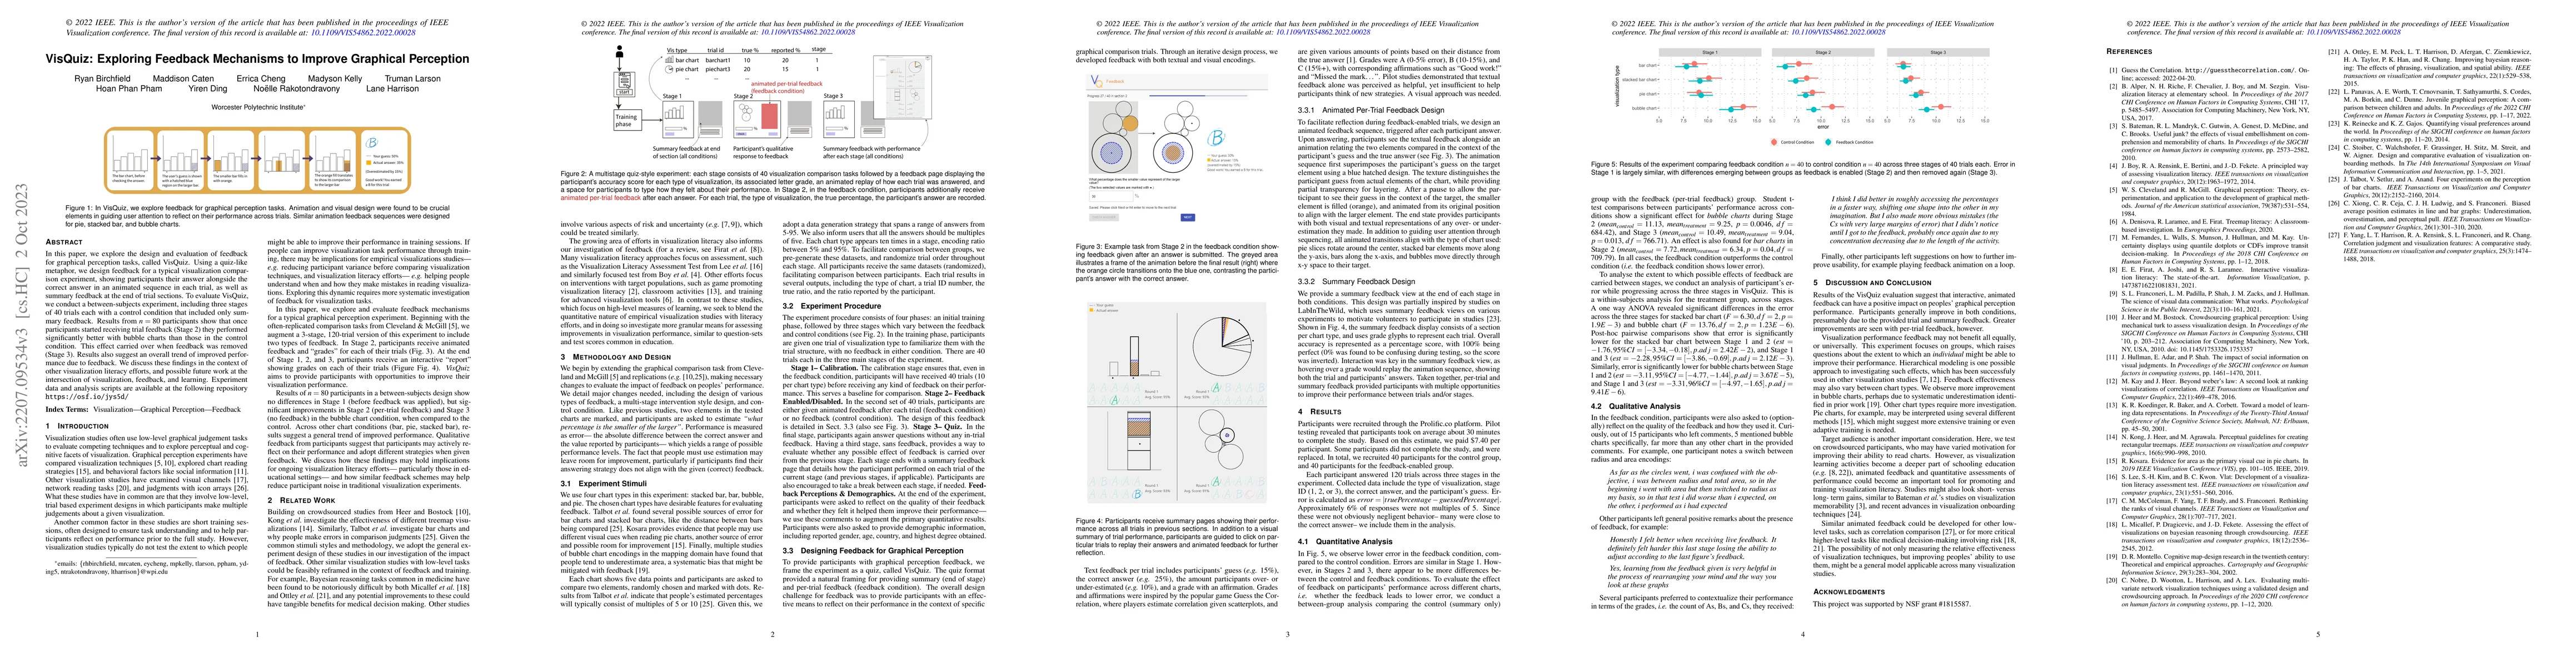
Graphical perception studies are a key element of visualization research, forming the basis of design recommendations and contributing to our understanding of how people make sense of visualizations. However, graphical perception studies typically include only brief training sessions, and the impact of longer and more in-depth feedback remains unclear. In this paper, we explore the design and evaluation of feedback for graphical perception tasks, called VisQuiz. Using a quiz-like metaphor, we design feedback for a typical visualization comparison experiment, showing participants their answer alongside the correct answer in an animated sequence in each trial. We extend this quiz metaphor to include summary feedback after each stage of the experiment, providing additional moments for participants to reflect on their performance. To evaluate VisQuiz, we conduct a between-subjects experiment, including three stages of 40 trials each with a control condition that included only summary feedback. Results from n = 80 participants show that once participants started receiving trial feedback (Stage 2) they performed significantly better with bubble charts than those in the control condition. This effect carried over when feedback was removed (Stage 3). Results also suggest an overall trend of improved performance due to feedback. We discuss these findings in the context of other visualization literacy efforts, and possible future work at the intersection of visualization, feedback, and learning. Experiment data and analysis scripts are available at the following repository https://osf.io/jys5d/
AI Key Findings
Get AI-generated insights about this paper's methodology, results, significance, and more — seven facets brought into focus.
Impact
Paper Details
Authors
PDF Preview
Key Terms
Citation Network
Current paper (gray), citations (green), references (blue)
Display is limited for performance on very large graphs.
Discussion 0