Publication
Metrics
AI Quick Summary
This paper explores the use of Hidden Markov Models (HMMs) to predict stock market prices based on historical data, focusing on closing prices from opening prices and previous day's prices. The model's effectiveness is evaluated using Mean Average Prediction Error (MAPE) and Directional Prediction Accuracy (DPA), demonstrating potential for improved investment decision-making.
Paper Preview
Abstract
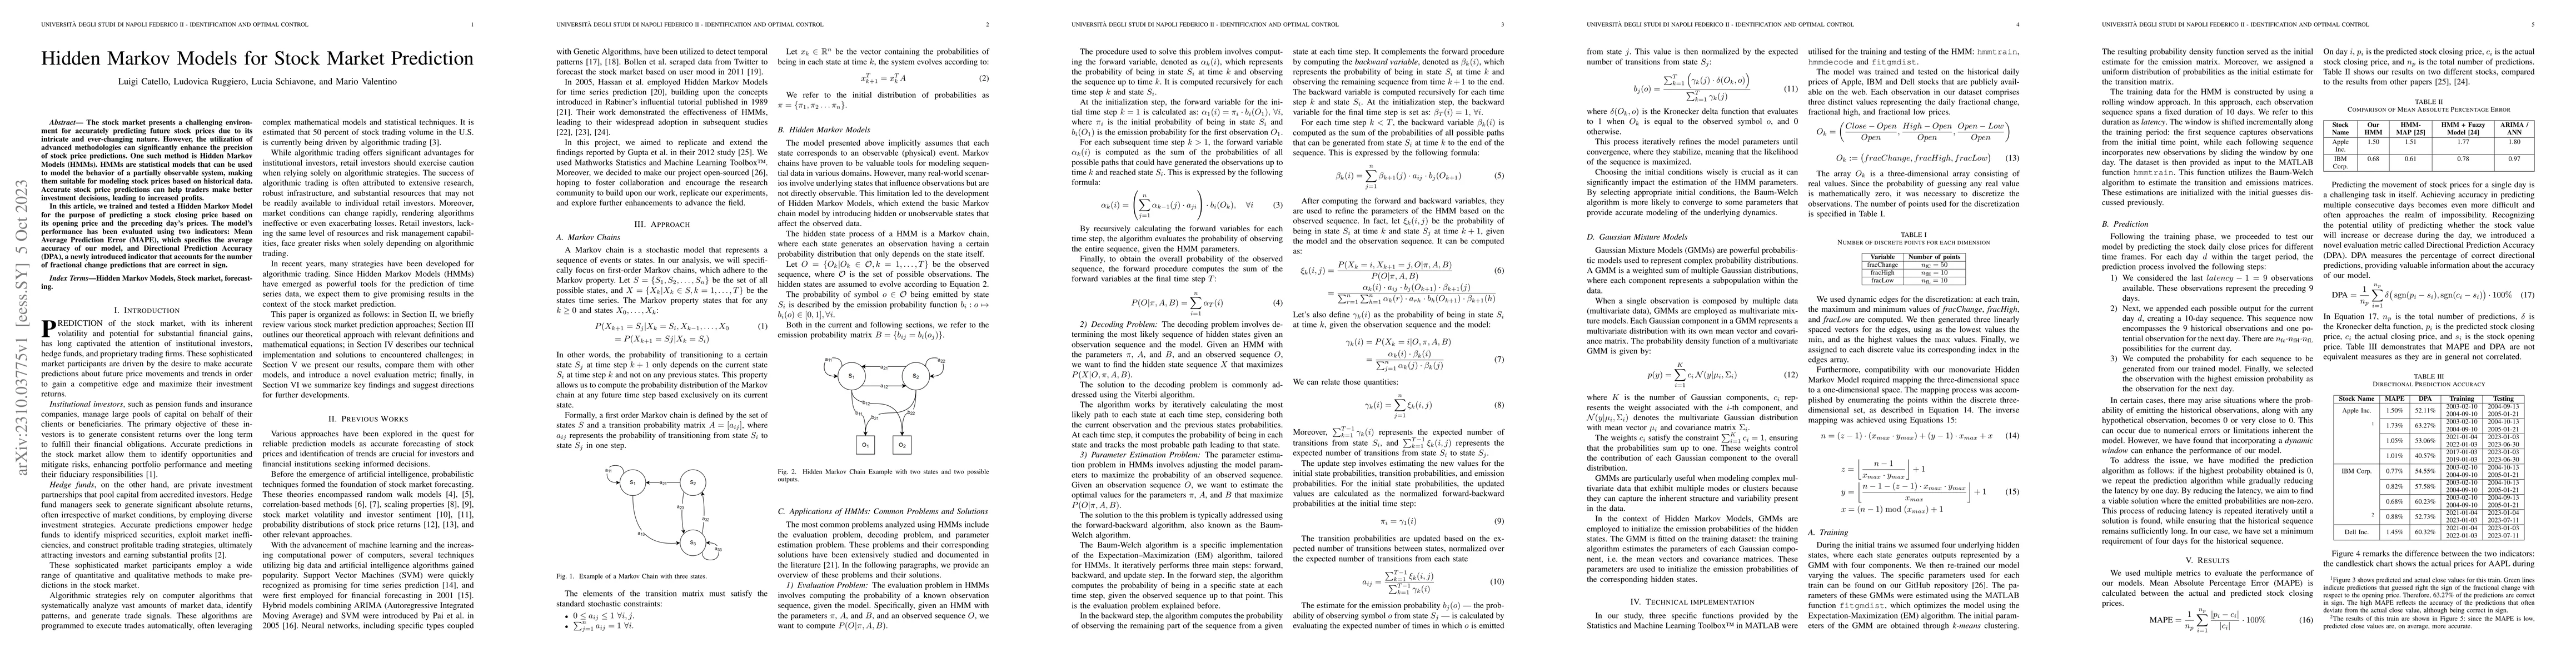
The stock market presents a challenging environment for accurately predicting future stock prices due to its intricate and ever-changing nature. However, the utilization of advanced methodologies can significantly enhance the precision of stock price predictions. One such method is Hidden Markov Models (HMMs). HMMs are statistical models that can be used to model the behavior of a partially observable system, making them suitable for modeling stock prices based on historical data. Accurate stock price predictions can help traders make better investment decisions, leading to increased profits. In this article, we trained and tested a Hidden Markov Model for the purpose of predicting a stock closing price based on its opening price and the preceding day's prices. The model's performance has been evaluated using two indicators: Mean Average Prediction Error (MAPE), which specifies the average accuracy of our model, and Directional Prediction Accuracy (DPA), a newly introduced indicator that accounts for the number of fractional change predictions that are correct in sign.
AI Key Findings
Get AI-generated insights about this paper's methodology, results, significance, and more — seven facets brought into focus.
Impact
Paper Details
Authors
PDF Preview
Key Terms
Citation Network
Current paper (gray), citations (green), references (blue)
Display is limited for performance on very large graphs.
Discussion 0