Publication
Metrics
AI Quick Summary
This paper analyzes stock market trends using Hidden Markov Models (HMM) to identify patterns in price movements. It determines the one-day difference in stock close values to generate optimal hidden state sequences, aiming to predict future market trends based on steady-state probability distributions.
Paper Preview
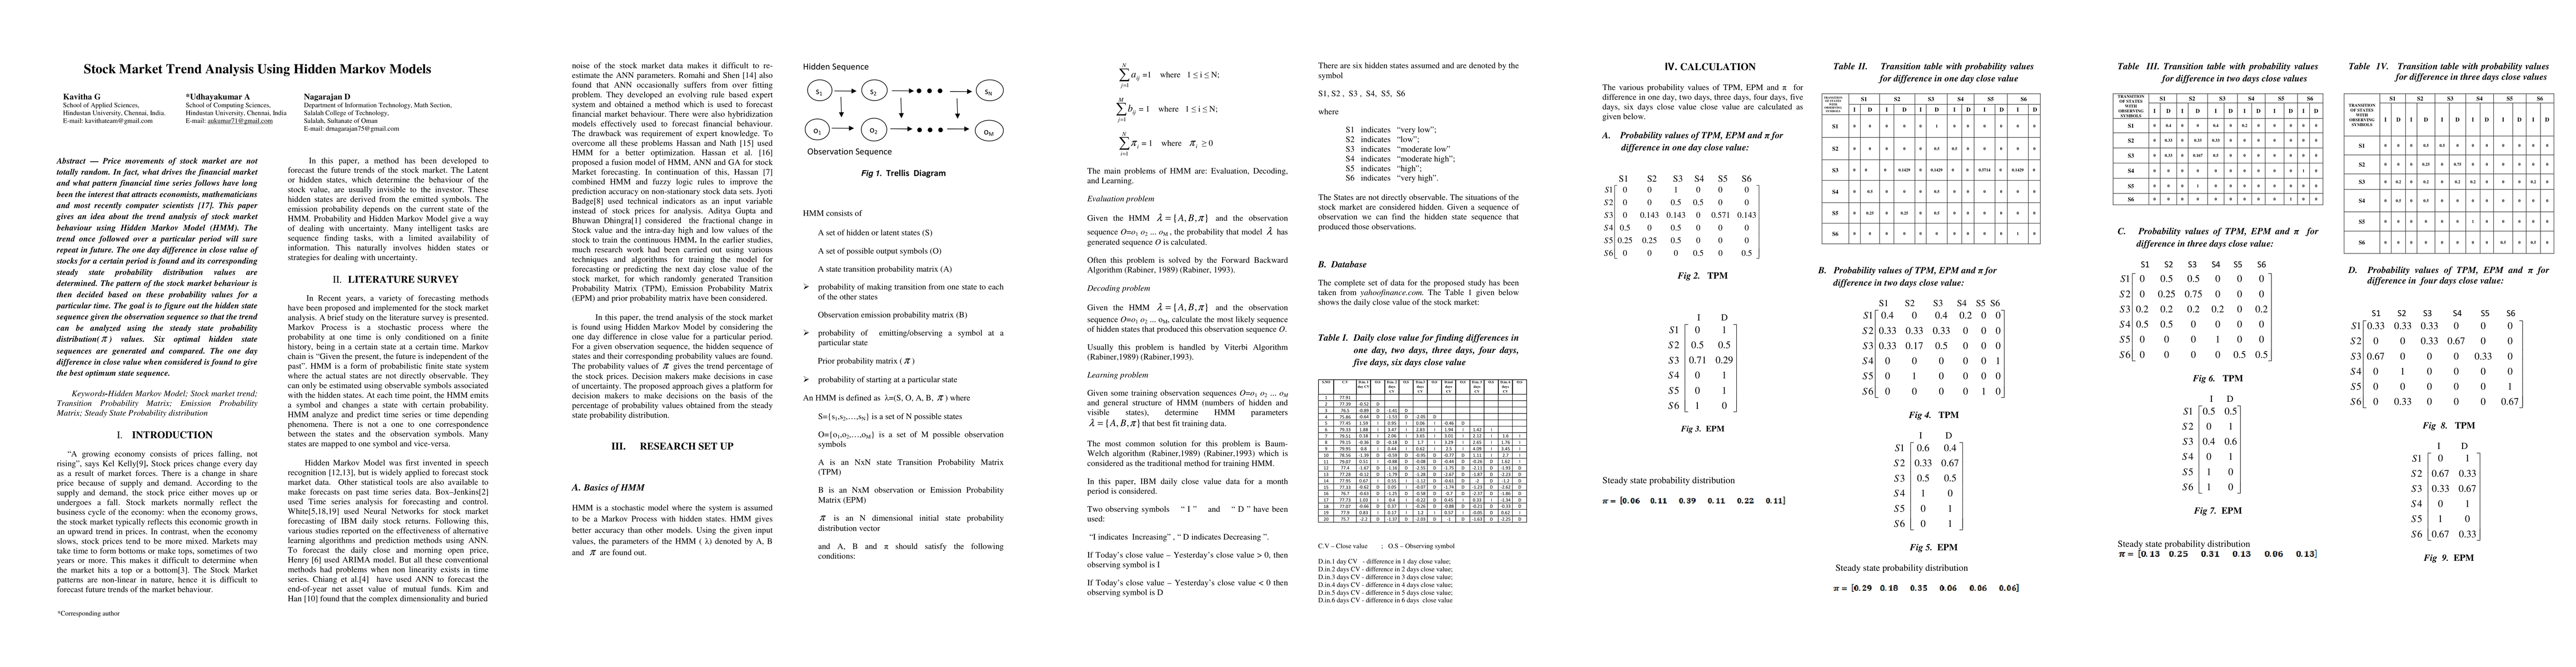
Abstract
Price movements of stock market are not totally random. In fact, what drives the financial market and what pattern financial time series follows have long been the interest that attracts economists, mathematicians and most recently computer scientists [17]. This paper gives an idea about the trend analysis of stock market behaviour using Hidden Markov Model (HMM). The trend once followed over a particular period will sure repeat in future. The one day difference in close value of stocks for a certain period is found and its corresponding steady state probability distribution values are determined. The pattern of the stock market behaviour is then decided based on these probability values for a particular time. The goal is to figure out the hidden state sequence given the observation sequence so that the trend can be analyzed using the steady state probability distribution( ) values. Six optimal hidden state sequences are generated and compared. The one day difference in close value when considered is found to give the best optimum state sequence.
AI Key Findings
Get AI-generated insights about this paper's methodology, results, significance, and more — seven facets brought into focus.
Impact
Paper Details
PDF Preview
Key Terms
Citation Network
Current paper (gray), citations (green), references (blue)
Display is limited for performance on very large graphs.
Discussion 0