Publication
Metrics
AI Quick Summary
This paper proposes two algorithms—Hierarchical Risk Parity (HRP) and Critical Line Algorithm (CLA)—for designing portfolios on NIFTY 50 stocks, showing that while CLA performs better on training data, HRP outperforms CLA in backtesting on new data from 2021.
Paper Preview
Abstract
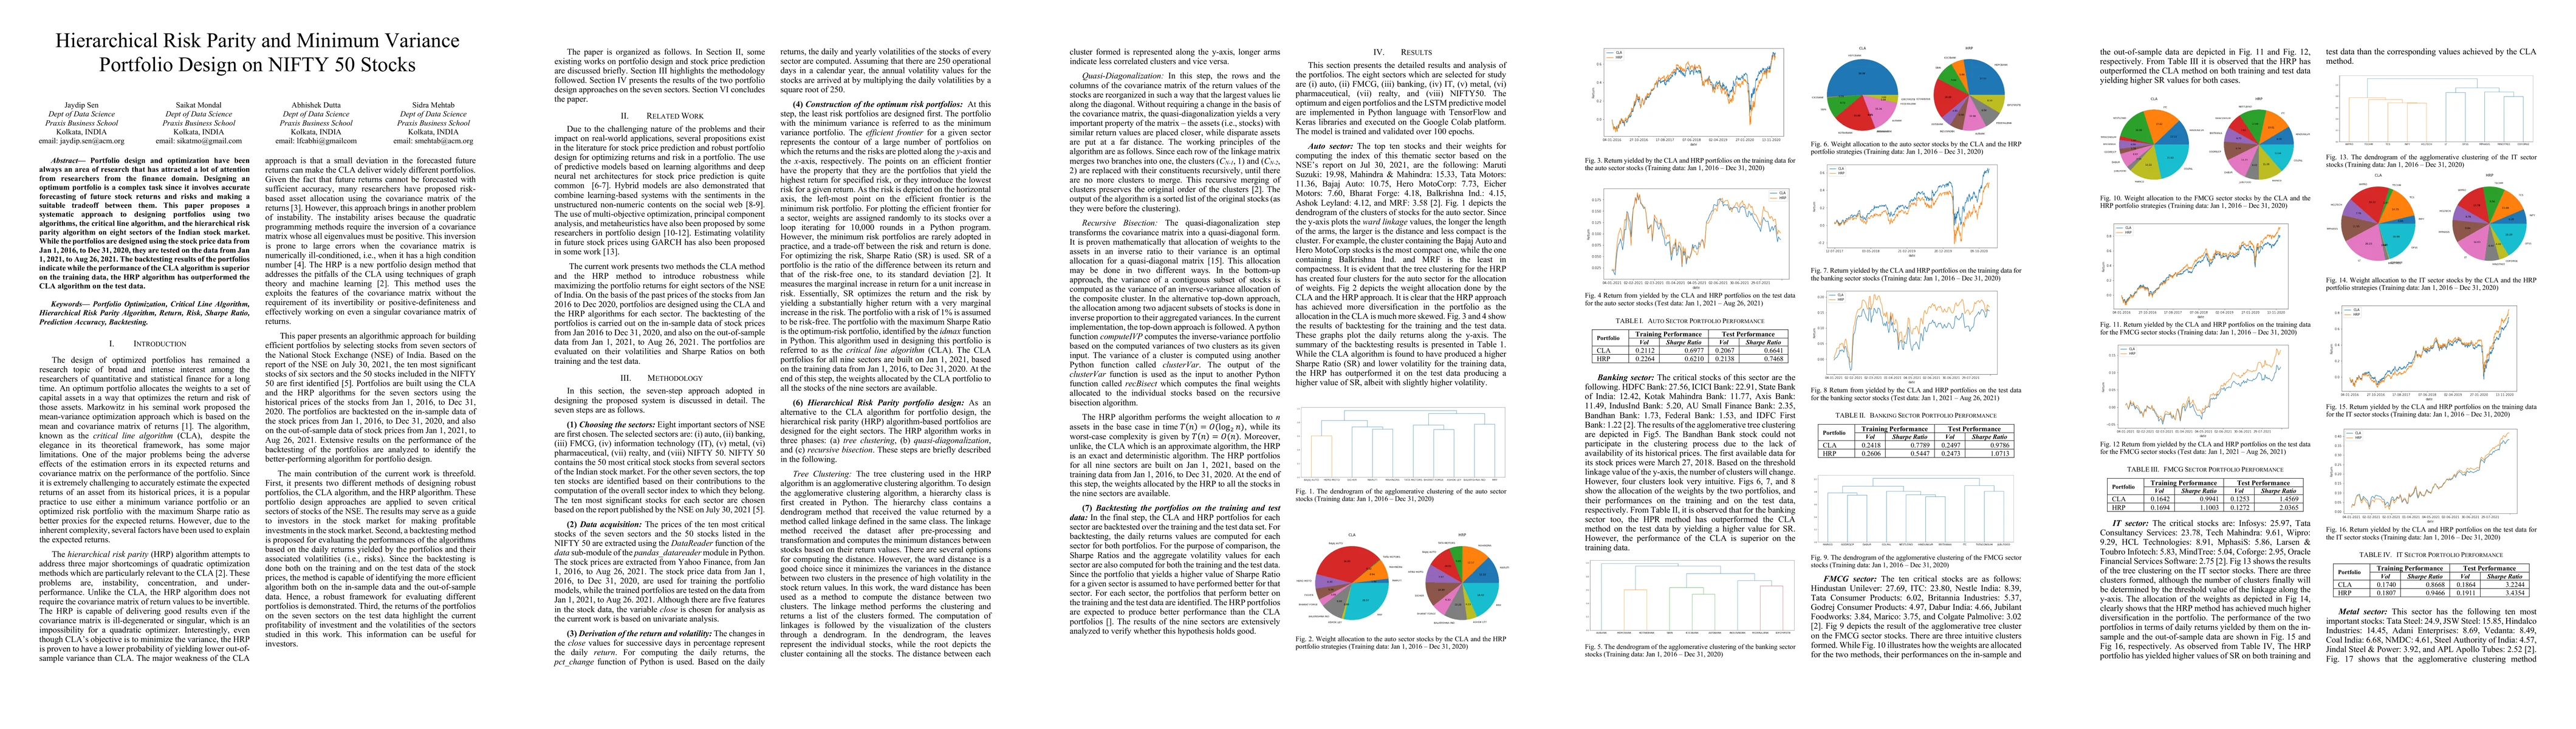
Portfolio design and optimization have been always an area of research that has attracted a lot of attention from researchers from the finance domain. Designing an optimum portfolio is a complex task since it involves accurate forecasting of future stock returns and risks and making a suitable tradeoff between them. This paper proposes a systematic approach to designing portfolios using two algorithms, the critical line algorithm, and the hierarchical risk parity algorithm on eight sectors of the Indian stock market. While the portfolios are designed using the stock price data from Jan 1, 2016, to Dec 31, 2020, they are tested on the data from Jan 1, 2021, to Aug 26, 2021. The backtesting results of the portfolios indicate while the performance of the CLA algorithm is superior on the training data, the HRP algorithm has outperformed the CLA algorithm on the test data.
AI Key Findings
Get AI-generated insights about this paper's methodology, results, significance, and more — seven facets brought into focus.
Impact
Paper Details
Authors
PDF Preview
Key Terms
Citation Network
Current paper (gray), citations (green), references (blue)
Display is limited for performance on very large graphs.
Discussion 0