Housing Forecasts via Stock Market Indicators
Publication
Metrics
AI Quick Summary
This paper reinterprets housing data as candlesticks and applies stock market technical indicators like MACD, RSI, and various candlestick patterns to forecast future housing market changes in the USA. The study finds bearish indicators more statistically significant than bullish ones, especially in stable markets, while noting slight differences in less stable or more populated countries.
Paper Preview
Abstract
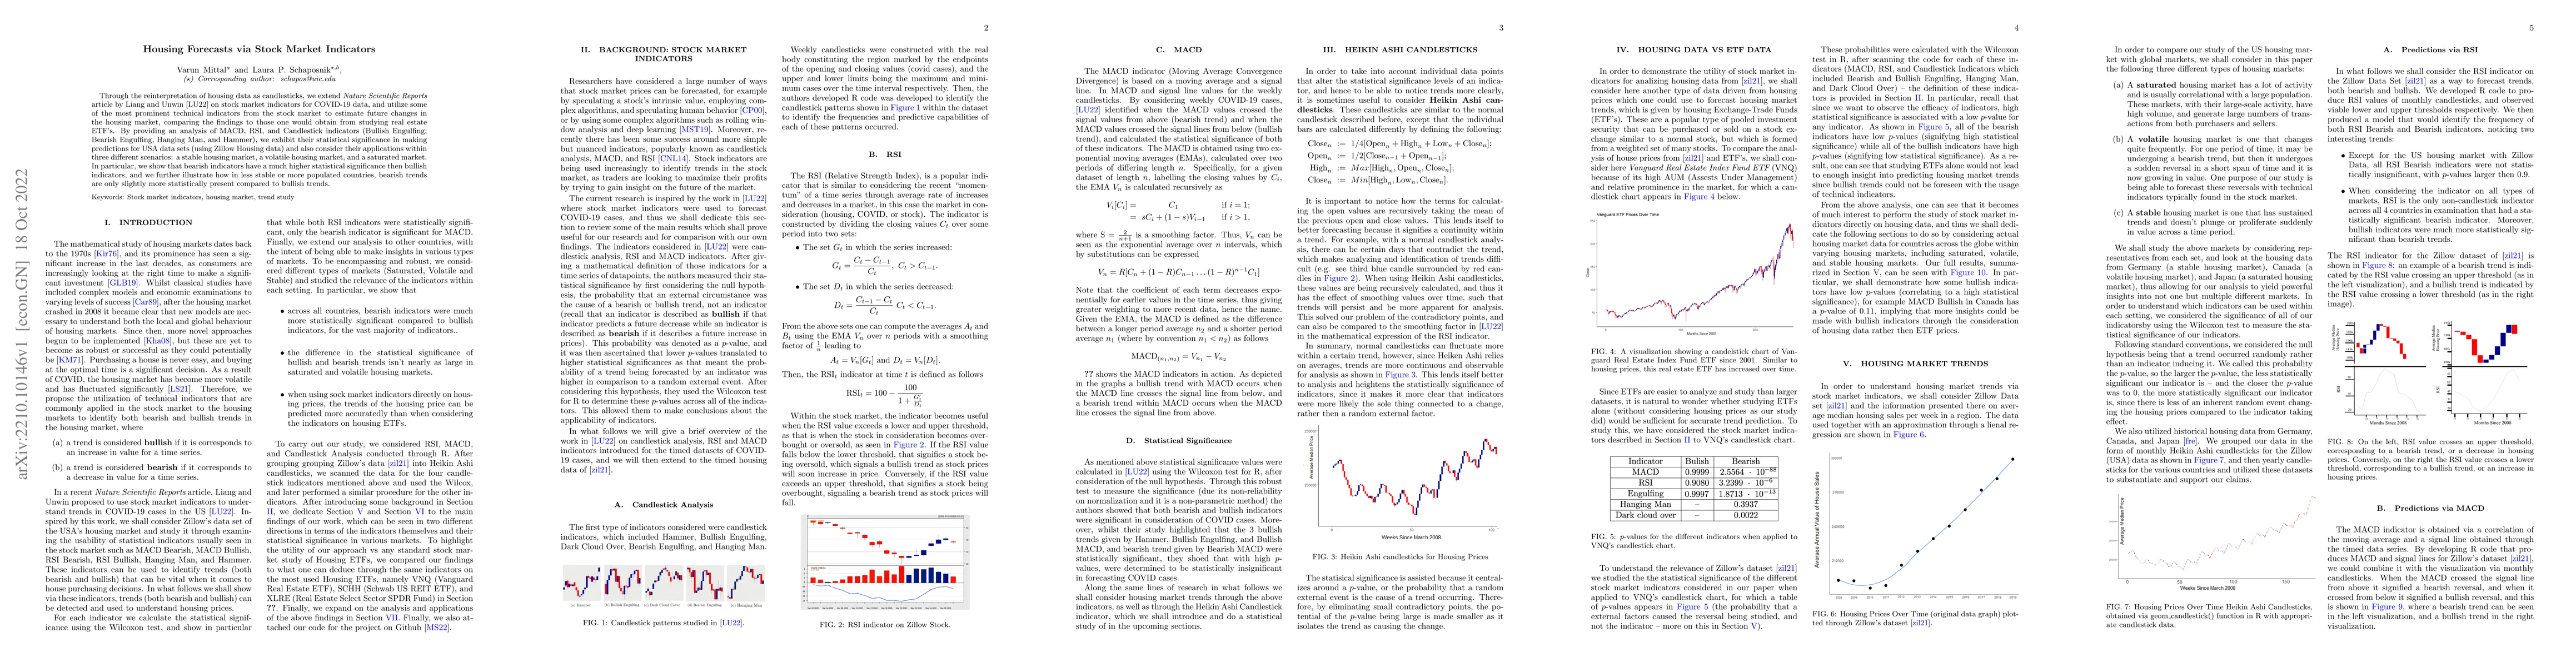
Through the reinterpretation of housing data as candlesticks, we extend Nature Scientific Reports' article by Liang and Unwin [LU22] on stock market indicators for COVID-19 data, and utilize some of the most prominent technical indicators from the stock market to estimate future changes in the housing market, comparing the findings to those one would obtain from studying real estate ETF's. By providing an analysis of MACD, RSI, and Candlestick indicators (Bullish Engulfing, Bearish Engulfing, Hanging Man, and Hammer), we exhibit their statistical significance in making predictions for USA data sets (using Zillow Housing data) and also consider their applications within three different scenarios: a stable housing market, a volatile housing market, and a saturated market. In particular, we show that bearish indicators have a much higher statistical significance then bullish indicators, and we further illustrate how in less stable or more populated countries, bearish trends are only slightly more statistically present compared to bullish trends.
AI Key Findings
Get AI-generated insights about this paper's methodology, results, significance, and more — seven facets brought into focus.
Impact
Paper Details
Authors
PDF Preview
Key Terms
Citation Network
Current paper (gray), citations (green), references (blue)
Display is limited for performance on very large graphs.
Discussion 0