Publication
Metrics
AI Quick Summary
This paper introduces the trace plot as a valuable tool in meta-analysis, illustrating its use in both Bayesian and frequentist frameworks to visualize the sensitivity of parameter estimates to the between-study standard deviation, tau. The paper emphasizes its importance in assessing the plausibility of tau values and demonstrates its application using R packages.
Paper Preview
Abstract
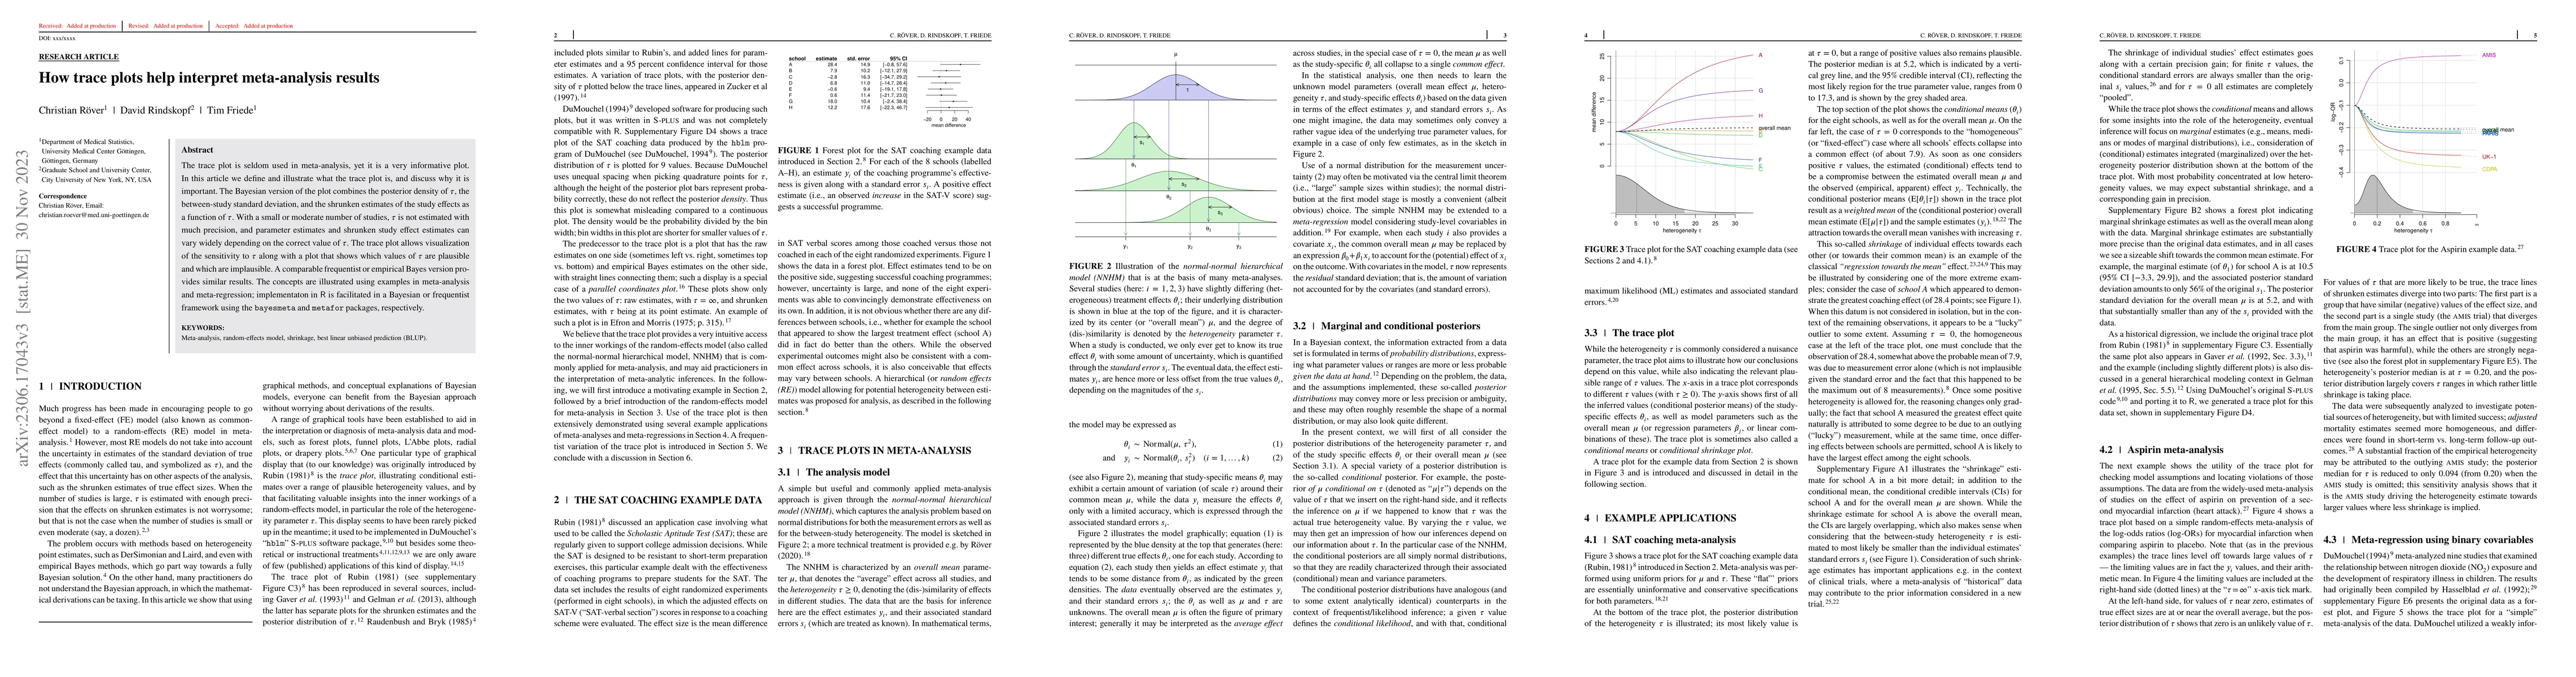
The trace plot is seldom used in meta-analysis, yet it is a very informative plot. In this article we define and illustrate what the trace plot is, and discuss why it is important. The Bayesian version of the plot combines the posterior density of tau, the between-study standard deviation, and the shrunken estimates of the study effects as a function of tau. With a small or moderate number of studies, tau is not estimated with much precision, and parameter estimates and shrunken study effect estimates can vary widely depending on the correct value of tau. The trace plot allows visualization of the sensitivity to tau along with a plot that shows which values of tau are plausible and which are implausible. A comparable frequentist or empirical Bayes version provides similar results. The concepts are illustrated using examples in meta-analysis and meta-regression; implementaton in R is facilitated in a Bayesian or frequentist framework using the bayesmeta and metafor packages, respectively.
AI Key Findings
Get AI-generated insights about this paper's methodology, results, significance, and more — seven facets brought into focus.
Impact
Paper Details
Authors
PDF Preview
Key Terms
Citation Network
Current paper (gray), citations (green), references (blue)
Display is limited for performance on very large graphs.
Discussion 0