Using Murphy-Good Plots to Interpret Field Emission Current-Voltage Data
Publication
Metrics
AI Quick Summary
This paper introduces the Murphy-Good plot for analyzing field electron emission current-voltage data, demonstrating its equivalence to the traditional Fowler-Nordheim plot while providing more precise characterization of the emission area, suggesting its potential to replace the older method.
Paper Preview
Abstract
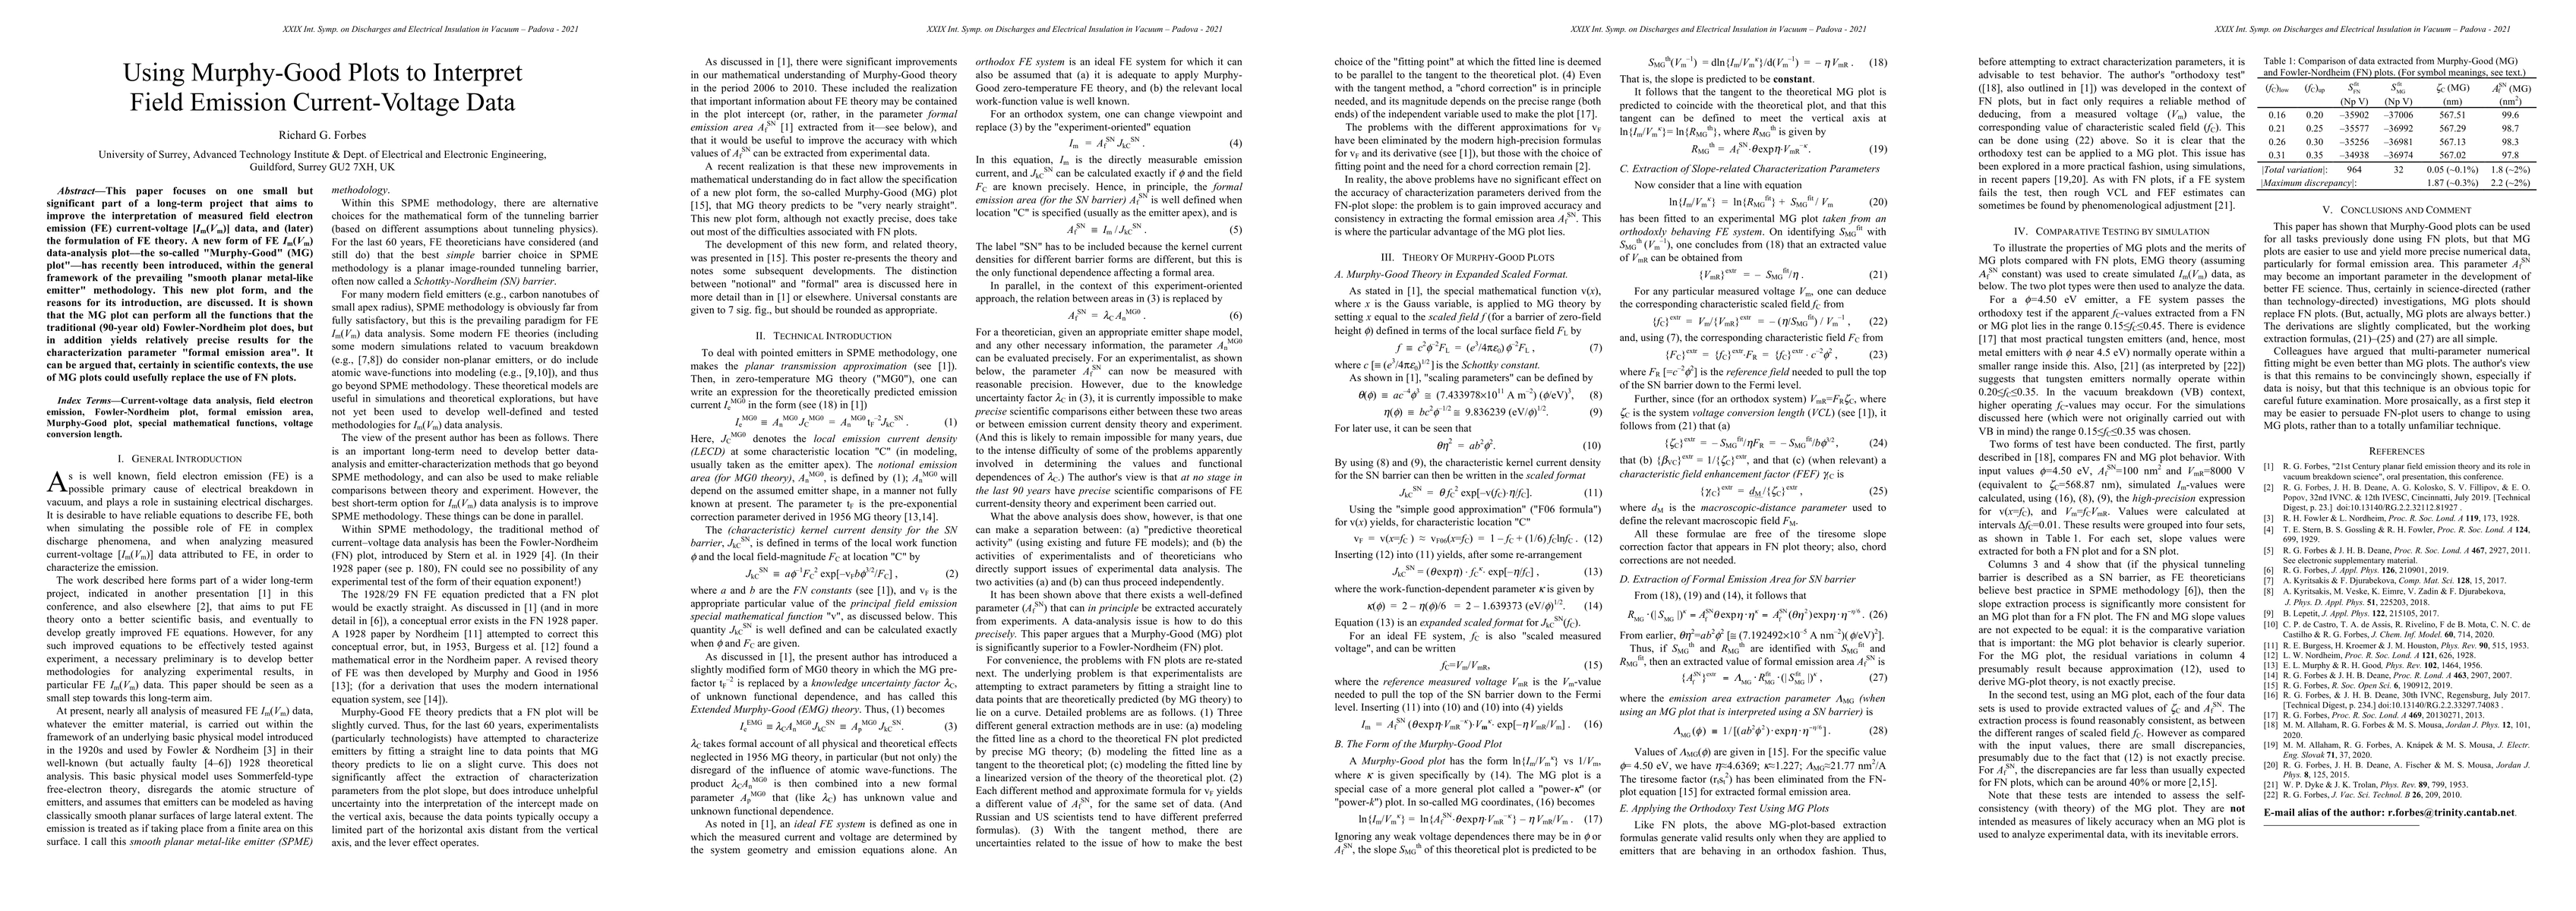
This paper focuses on one small but significant part of a long-term project that aims to improve the interpretation of measured field electron emission (FE) current-voltage [I_m(V_m)] data, and (later) the formulation of FE theory. A new form of FE I_m(V_m) data-analysis plot - the so-called "Murphy-Good (MG) plot" - has recently been introduced, within the general framework of the prevailing "smooth planar metal-like emitter" methodology. This new plot form, and the reasons for its introduction, are discussed. It is shown that the MG plot can perform all the functions that the traditional (90-year old) Fowler-Nordheim plot does, but in addition yields relatively precise results for the characterization parameter formal emission area. It can be argued that, certainly in scientific contexts, the use of MG plots could usefully replace the use of FN plots.
AI Key Findings
Get AI-generated insights about this paper's methodology, results, significance, and more — seven facets brought into focus.
Impact
Paper Details
Authors
PDF Preview
Key Terms
Citation Network
Current paper (gray), citations (green), references (blue)
Display is limited for performance on very large graphs.
Discussion 0