The Murphy-Good plot: a better method of analysing field emission data
Publication
Metrics
AI Quick Summary
The Murphy-Good plot offers a more accurate method for analyzing field electron emission data compared to traditional Fowler-Nordheim plots, as it predicts almost straight lines, facilitating precise extraction of emission parameters. This new approach should replace the outdated Fowler-Nordheim method to improve the interpretation of field emission data.
Paper Preview
Abstract
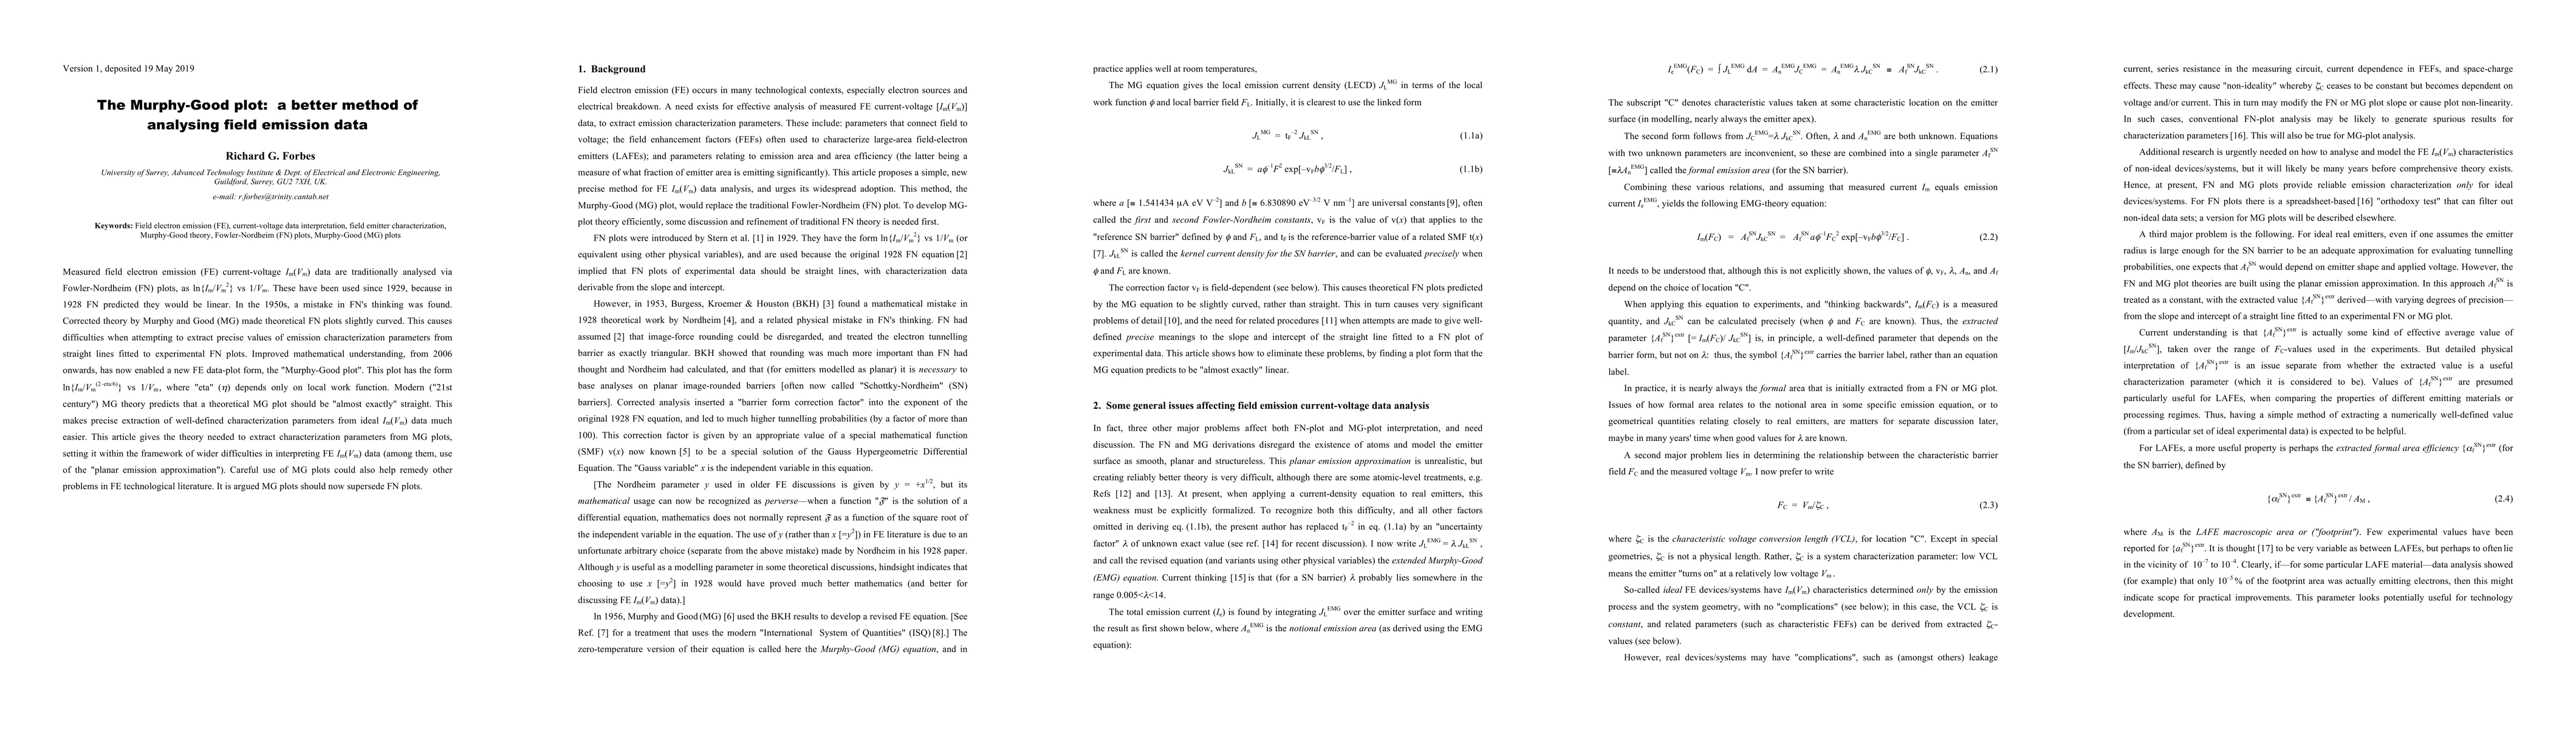
Measured field electron emission (FE) current-voltage Im(Vm) data are traditionally analysed via Fowler-Nordheim (FN) plots, as ln{Im/(Vm)**2} vs 1/Vm. These have been used since 1929, because in 1928 FN predicted they would be linear. In the 1950s, a mistake in FN's thinking was found. Corrected theory by Murphy and Good (MG) made theoretical FN plots slightly curved. This causes difficulties when attempting to extract precise values of emission characterization parameters from straight lines fitted to experimental FN plots. Improved mathematical understanding, from 2006 onwards, has now enabled a new FE data-plot form, the "Murphy-Good plot". This plots ln{Im/(Vm)**(2-({\eta}/6)} vs 1/Vm, where {\eta} depends only on local work function. Modern ("21st century") MG theory predicts that a theoretical MG plot should be "almost exactly" straight. This makes precise extraction of well-defined characterization parameters from ideal I_m(V_m) data much easier. This article gives the theory needed to extract characterization parameters from MG plots, setting it within the framework of wider difficulties in interpreting FE Im(Vm) data (among them, use of the "planar emission approximation"). Careful use of MG plots could also help remedy other problems in FE technological literature. It is argued MG plots should now supersede FN plots.
AI Key Findings
Get AI-generated insights about this paper's methodology, results, significance, and more — seven facets brought into focus.
Impact
Paper Details
PDF Preview
Key Terms
Citation Network
Current paper (gray), citations (green), references (blue)
Display is limited for performance on very large graphs.
Discussion 0