"I Came Across a Junk": Understanding Design Flaws of Data Visualization from the Public's Perspective
Publication
Metrics
AI Quick Summary
This paper examines design flaws in data visualization from the general public's perspective, constructing a framework to categorize these flaws and investigate their underlying causes, addressing gaps in existing research that primarily focuses on researcher insights.
Paper Preview
Abstract
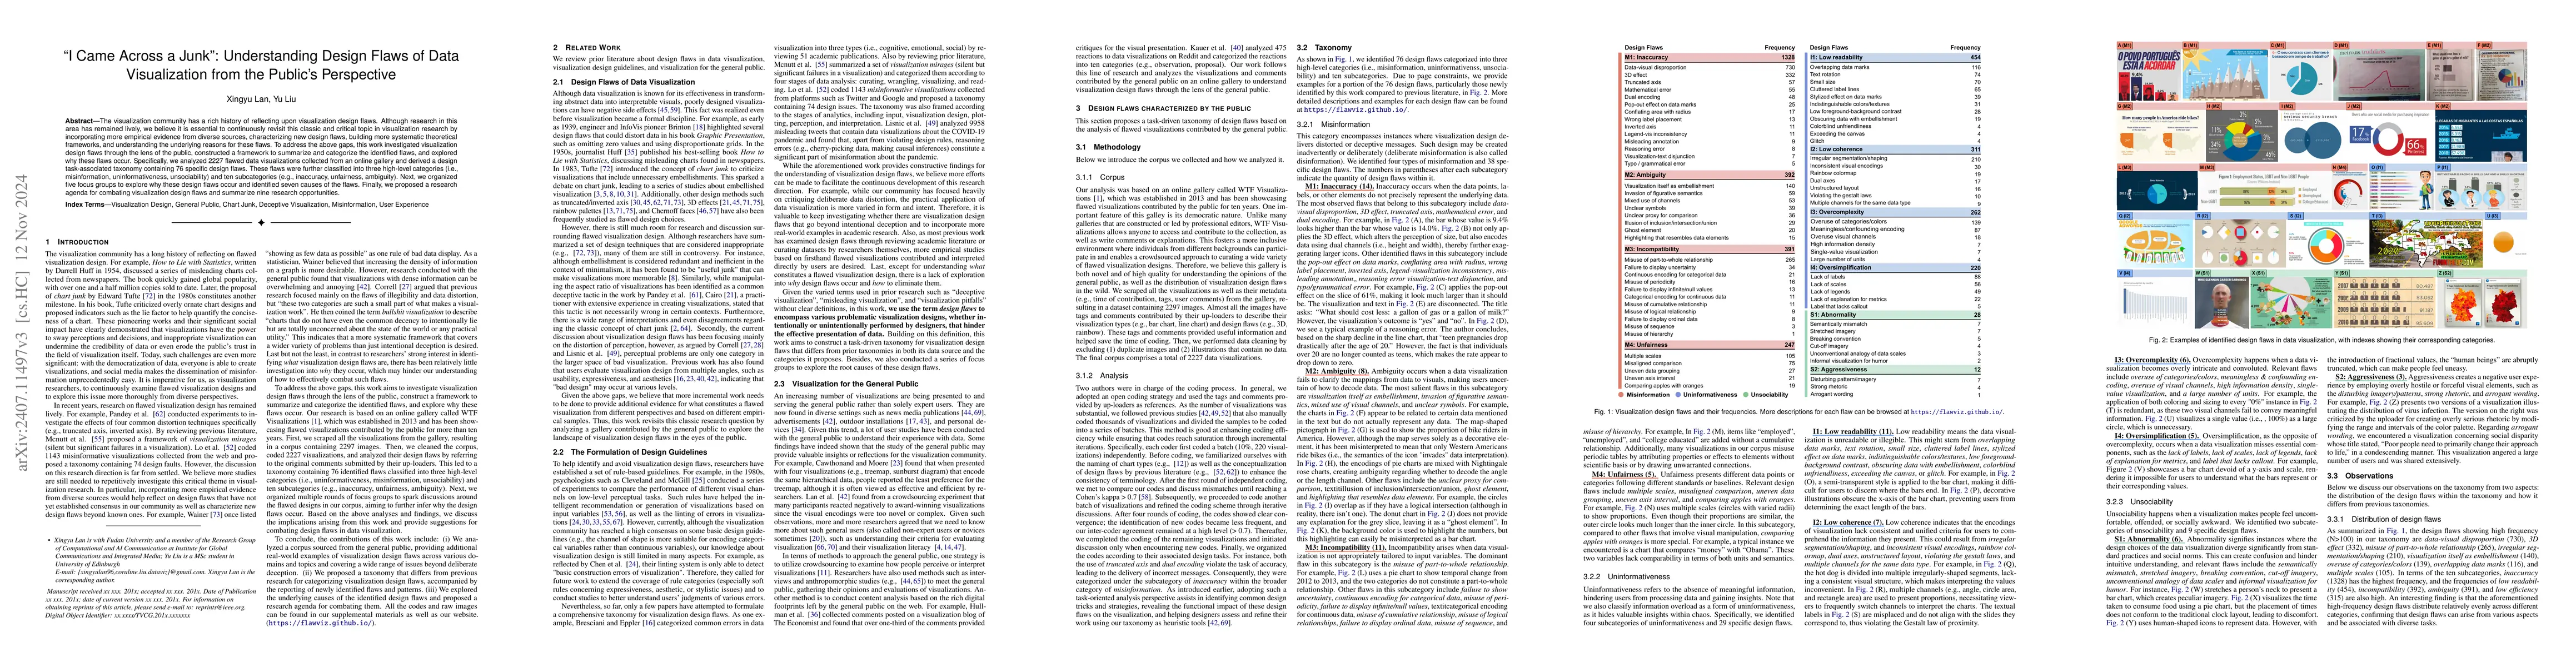
The visualization community has a rich history of reflecting upon flaws of visualization design, and research in this direction has remained lively until now. However, three main gaps still exist. First, most existing work characterizes design flaws from the perspective of researchers rather than the perspective of general users. Second, little work has been done to infer why these design flaws occur. Third, due to problems such as unclear terminology and ambiguous research scope, a better framework that systematically outlines various design flaws and helps distinguish different types of flaws is desired. To address the above gaps, this work investigated visualization design flaws through the lens of the public, constructed a framework to summarize and categorize the identified flaws, and explored why these flaws occur.
AI Key Findings
Get AI-generated insights about this paper's methodology, results, significance, and more — seven facets brought into focus.
Impact
Authors
PDF Preview
Citation Network
Current paper (gray), citations (green), references (blue)
Display is limited for performance on very large graphs.
Discussion 0