Academic Profile
Statistics
Similar Authors
Papers on arXiv
Storytelling is an ancient and precious human ability that has been rejuvenated in the digital age. Over the last decade, there has been a notable surge in the recognition and application of data st...
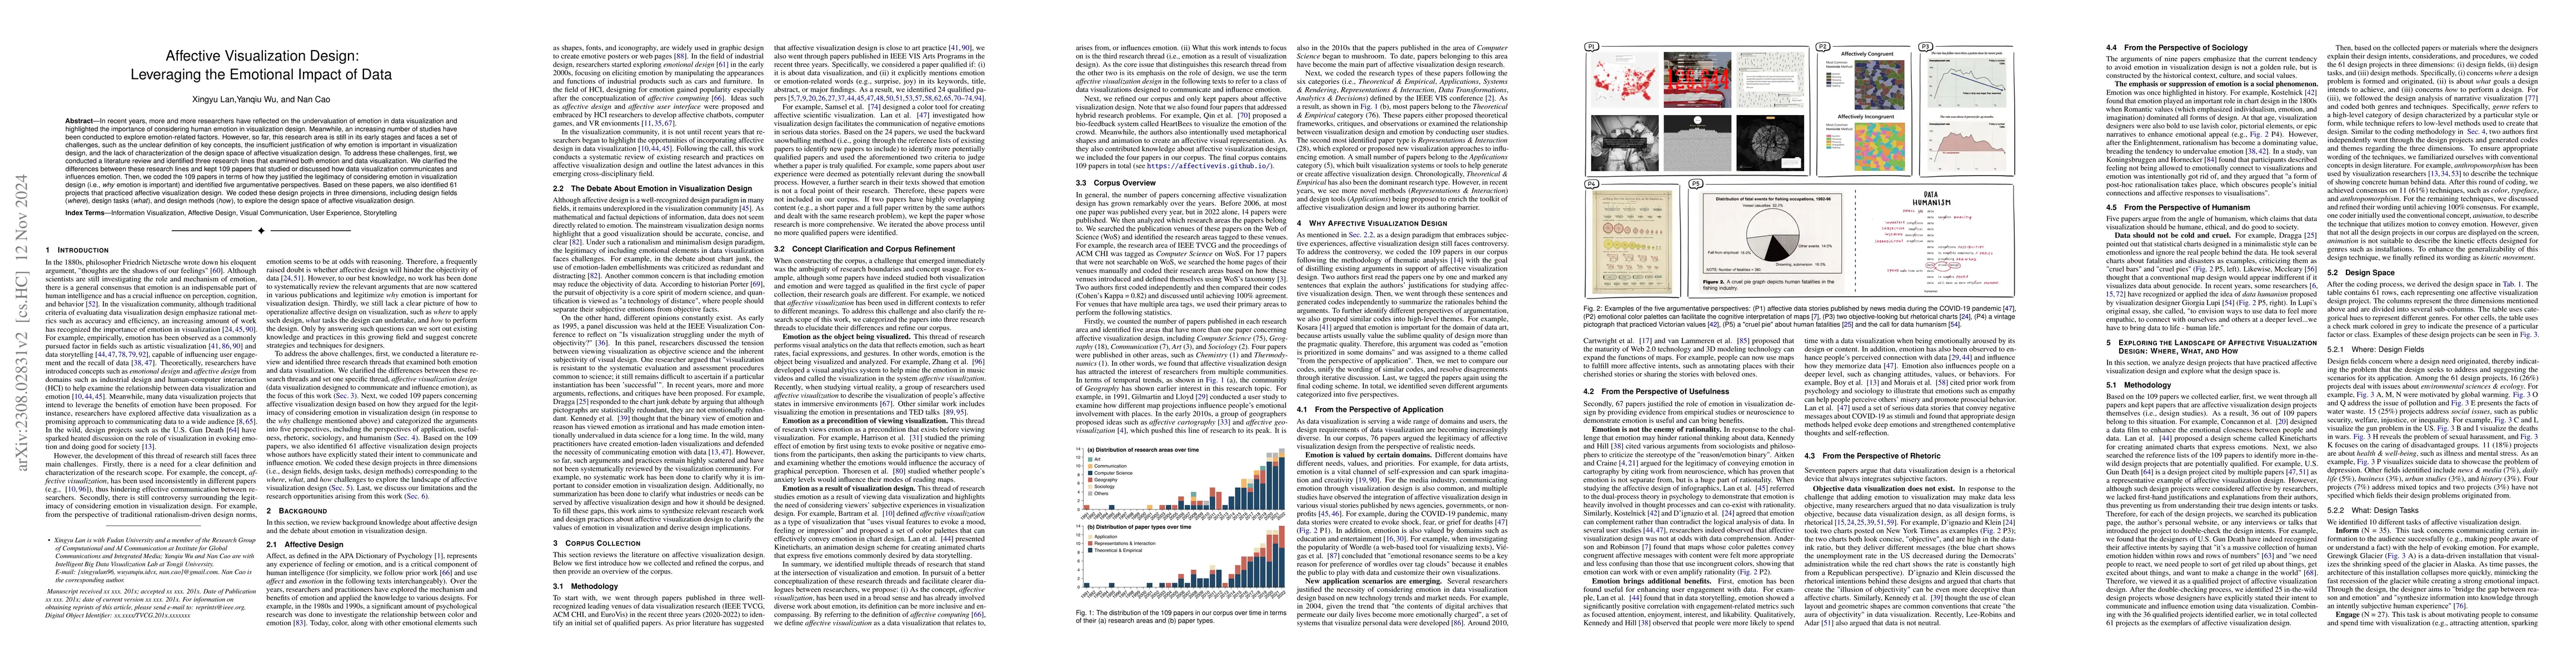
In recent years, more and more researchers have reflected on the undervaluation of emotion in data visualization and highlighted the importance of considering human emotion in visualization design. ...
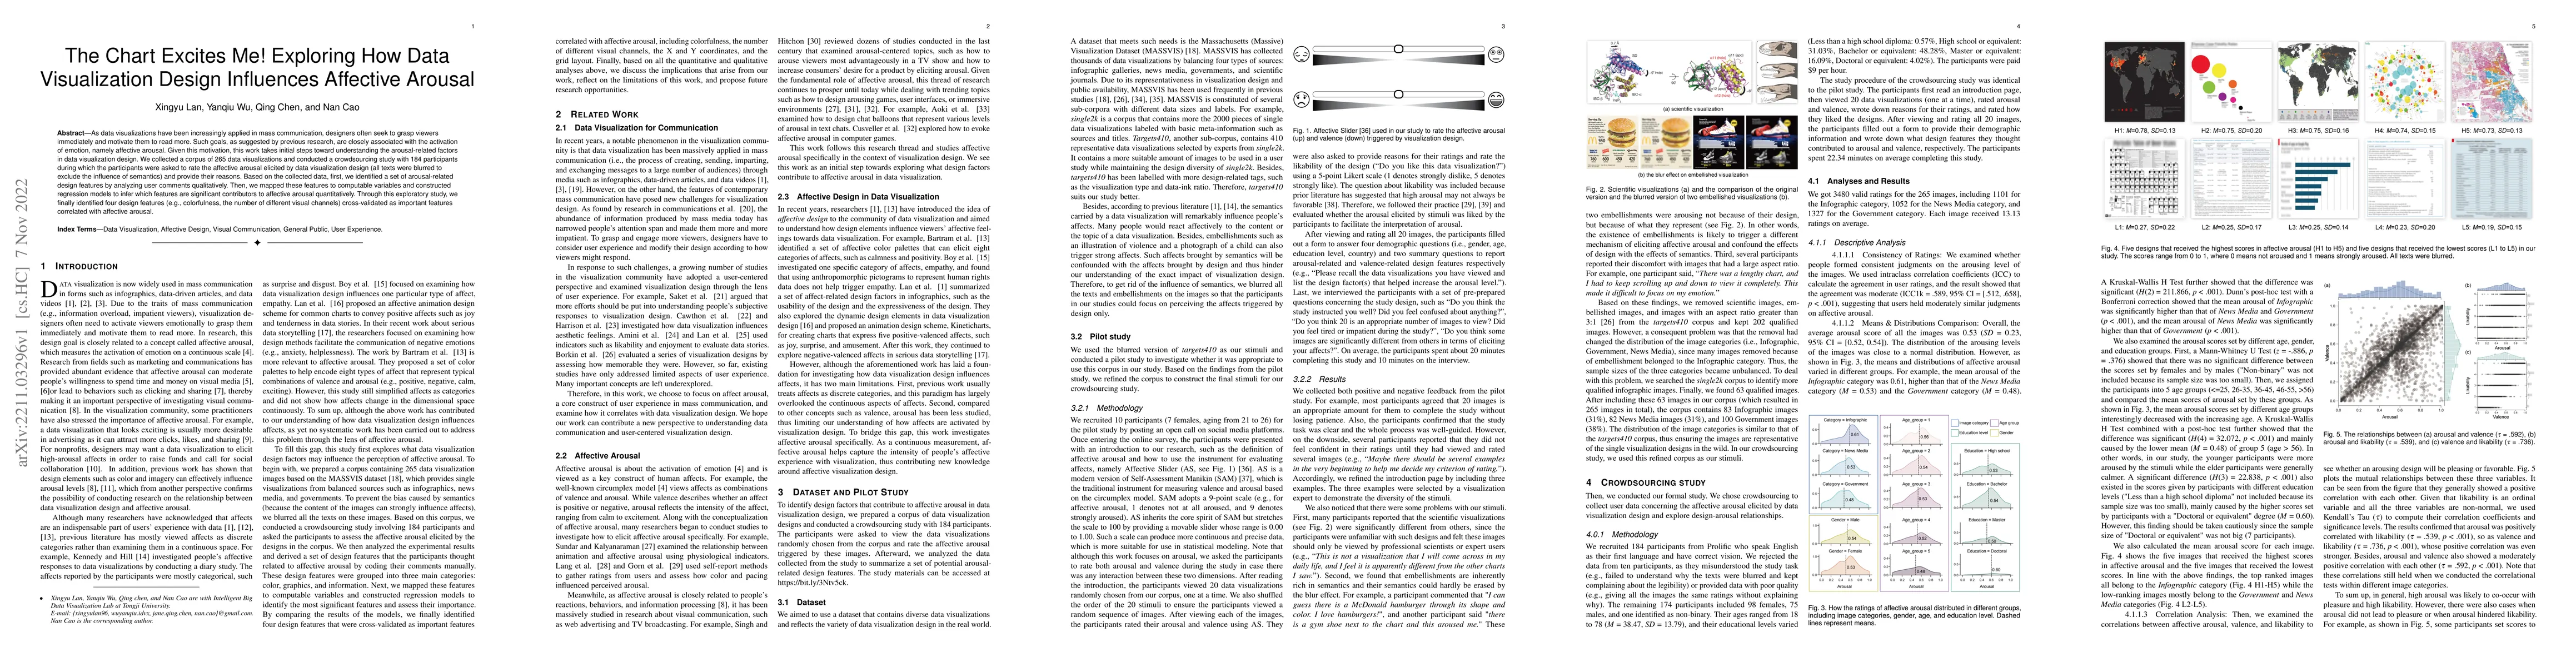
As data visualizations have been increasingly applied in mass communication, designers often seek to grasp viewers immediately and motivate them to read more. Such goals, as suggested by previous re...
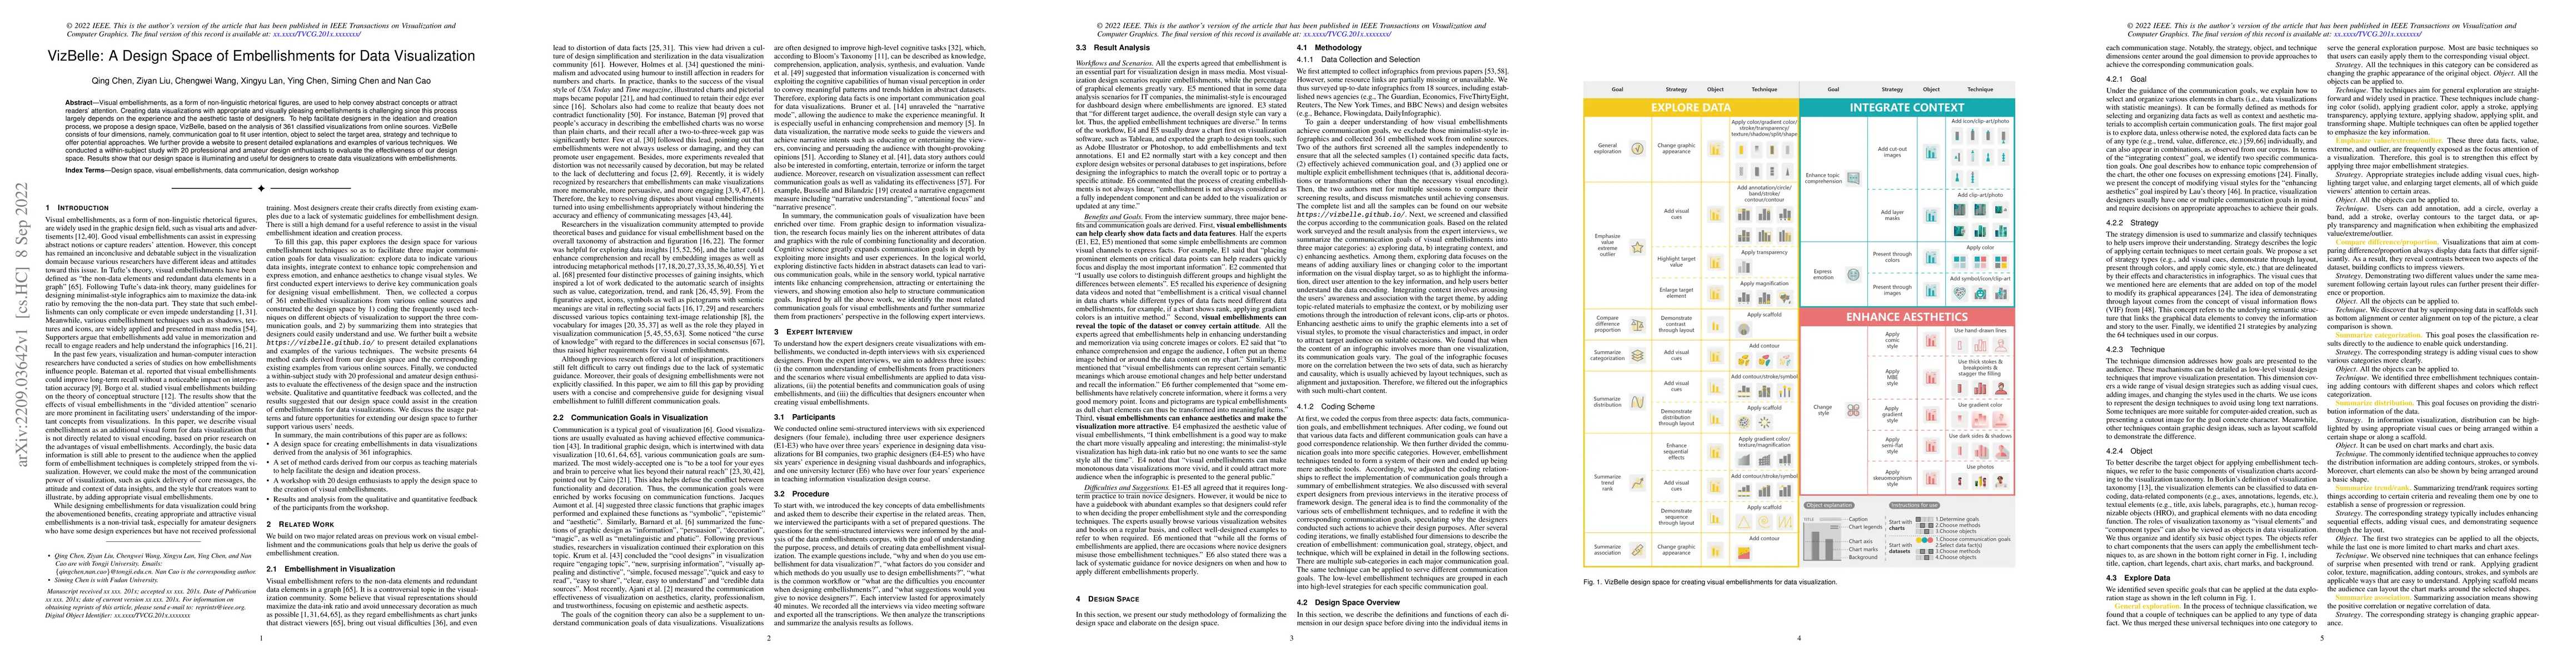
Visual embellishments, as a form of non-linguistic rhetorical figures, are used to help convey abstract concepts or attract readers' attention. Creating data visualizations with appropriate and visu...
The visualization community has a rich history of reflecting upon flaws of visualization design, and research in this direction has remained lively until now. However, three main gaps still exist. Fir...
Powered by large language models, the conversational capabilities of AI have seen significant improvements. In this context, a series of role-playing AI chatbots have emerged, exhibiting a strong tend...
The integration of data visualization in journalism has catalyzed the growth of data storytelling in recent years. Today, it is increasingly common for journalism schools to incorporate data visualiza...
Standing at the intersection of science and art, artistic data visualization has gained popularity in recent years and emerged as a significant domain. Despite more than a decade since the field's con...
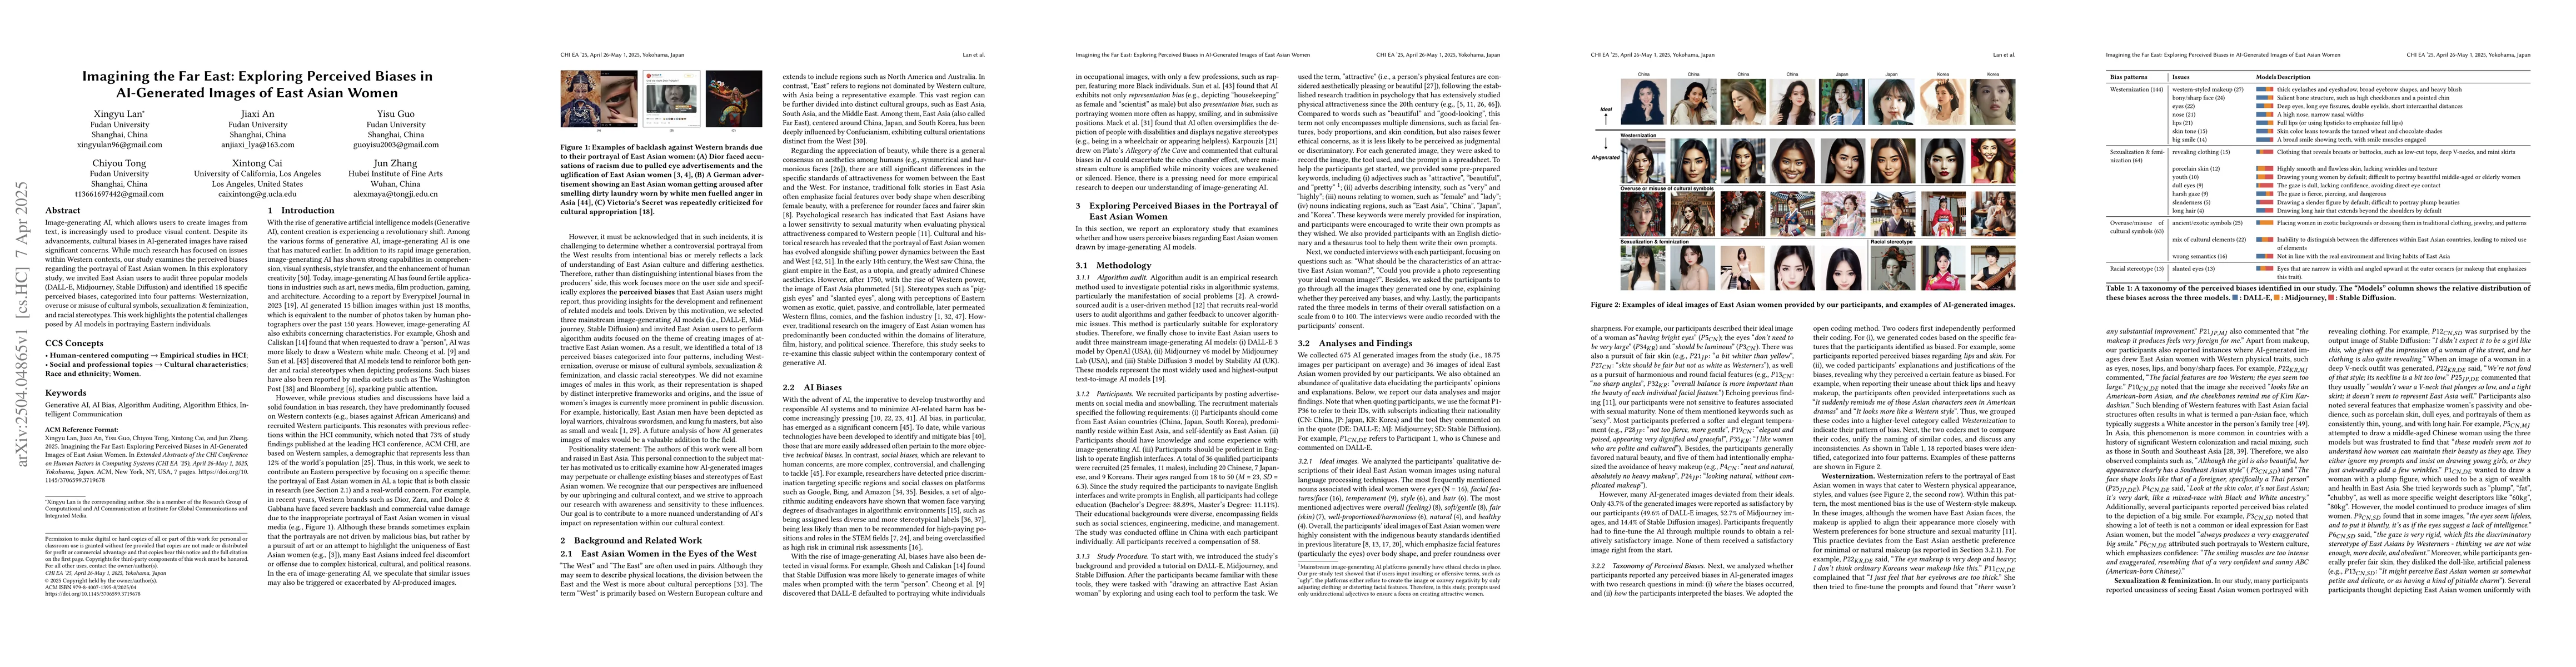
Image-generating AI, which allows users to create images from text, is increasingly used to produce visual content. Despite its advancements, cultural biases in AI-generated images have raised signifi...
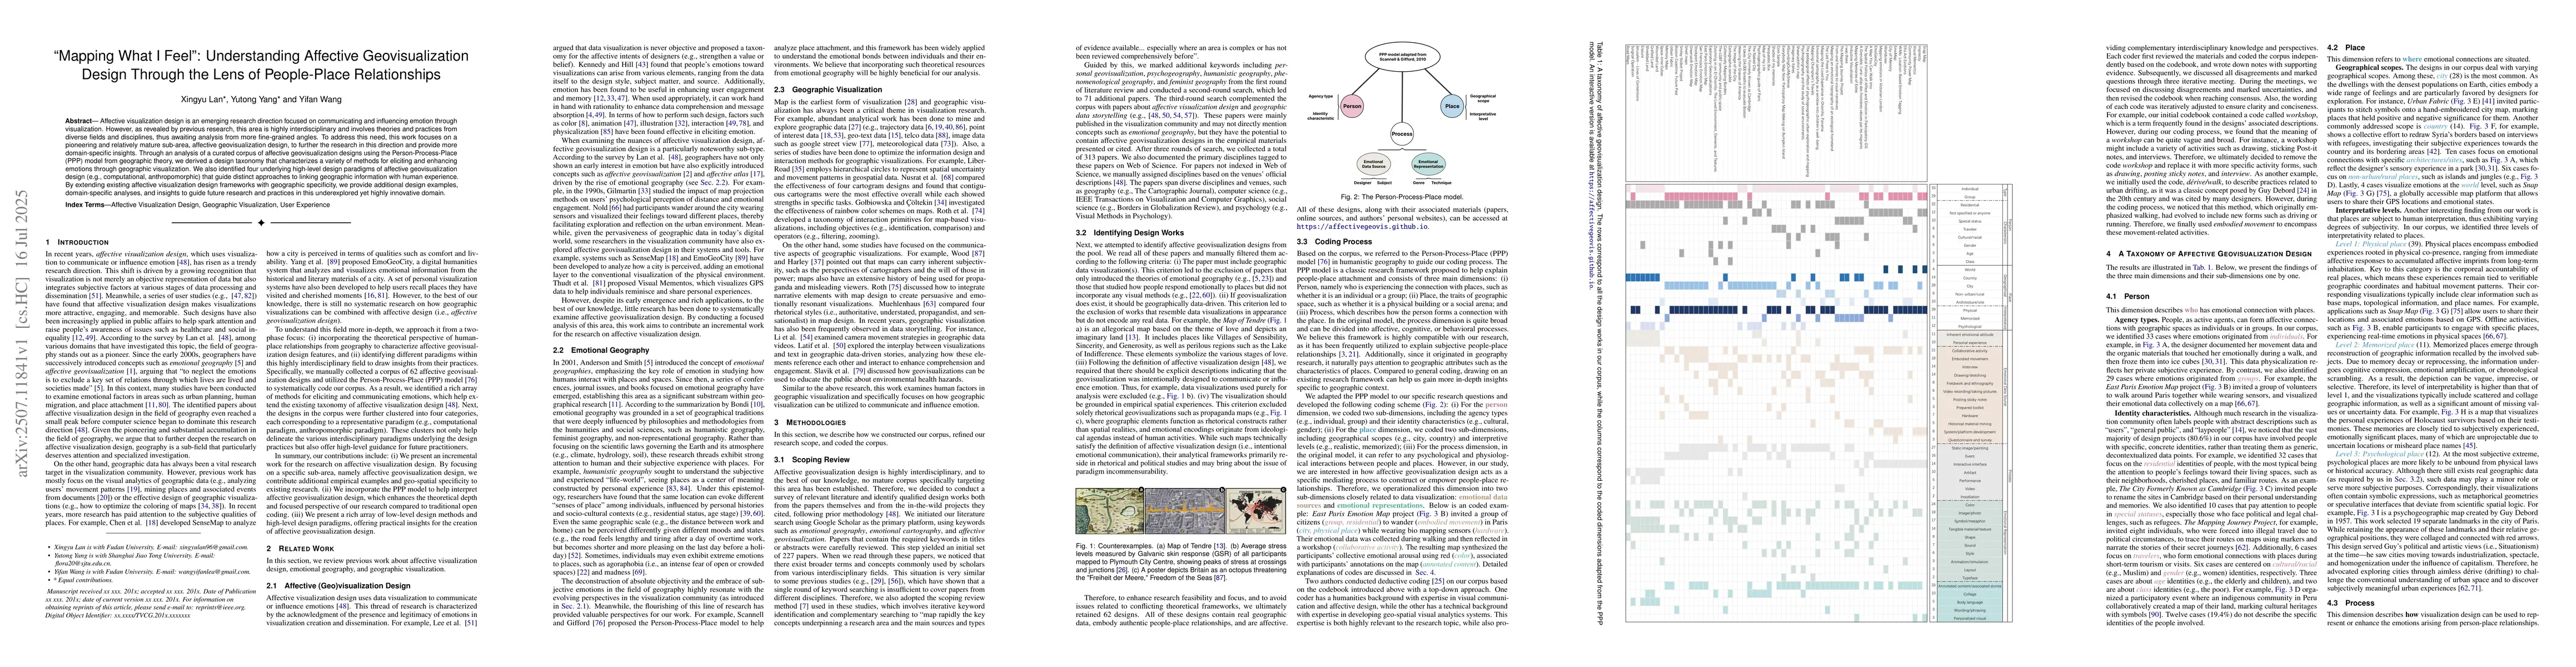
Affective visualization design is an emerging research direction focused on communicating and influencing emotion through visualization. However, as revealed by previous research, this area is highly ...
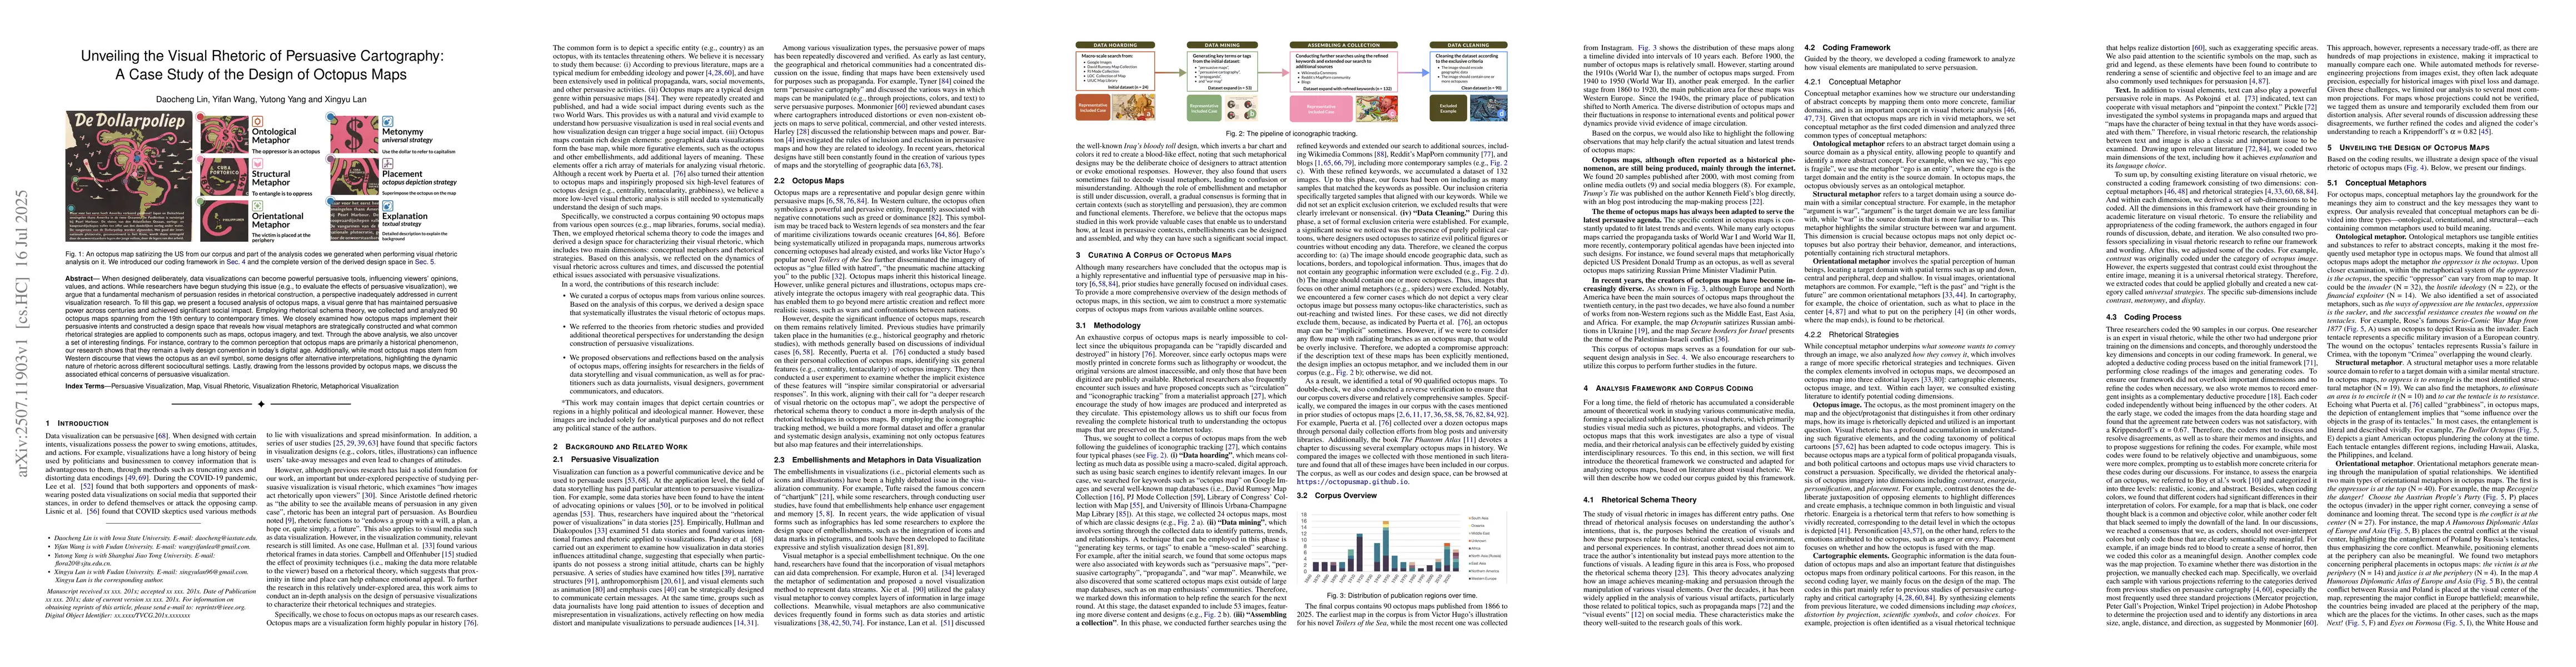
When designed deliberately, data visualizations can become powerful persuasive tools, influencing viewers' opinions, values, and actions. While researchers have begun studying this issue (e.g., to eva...
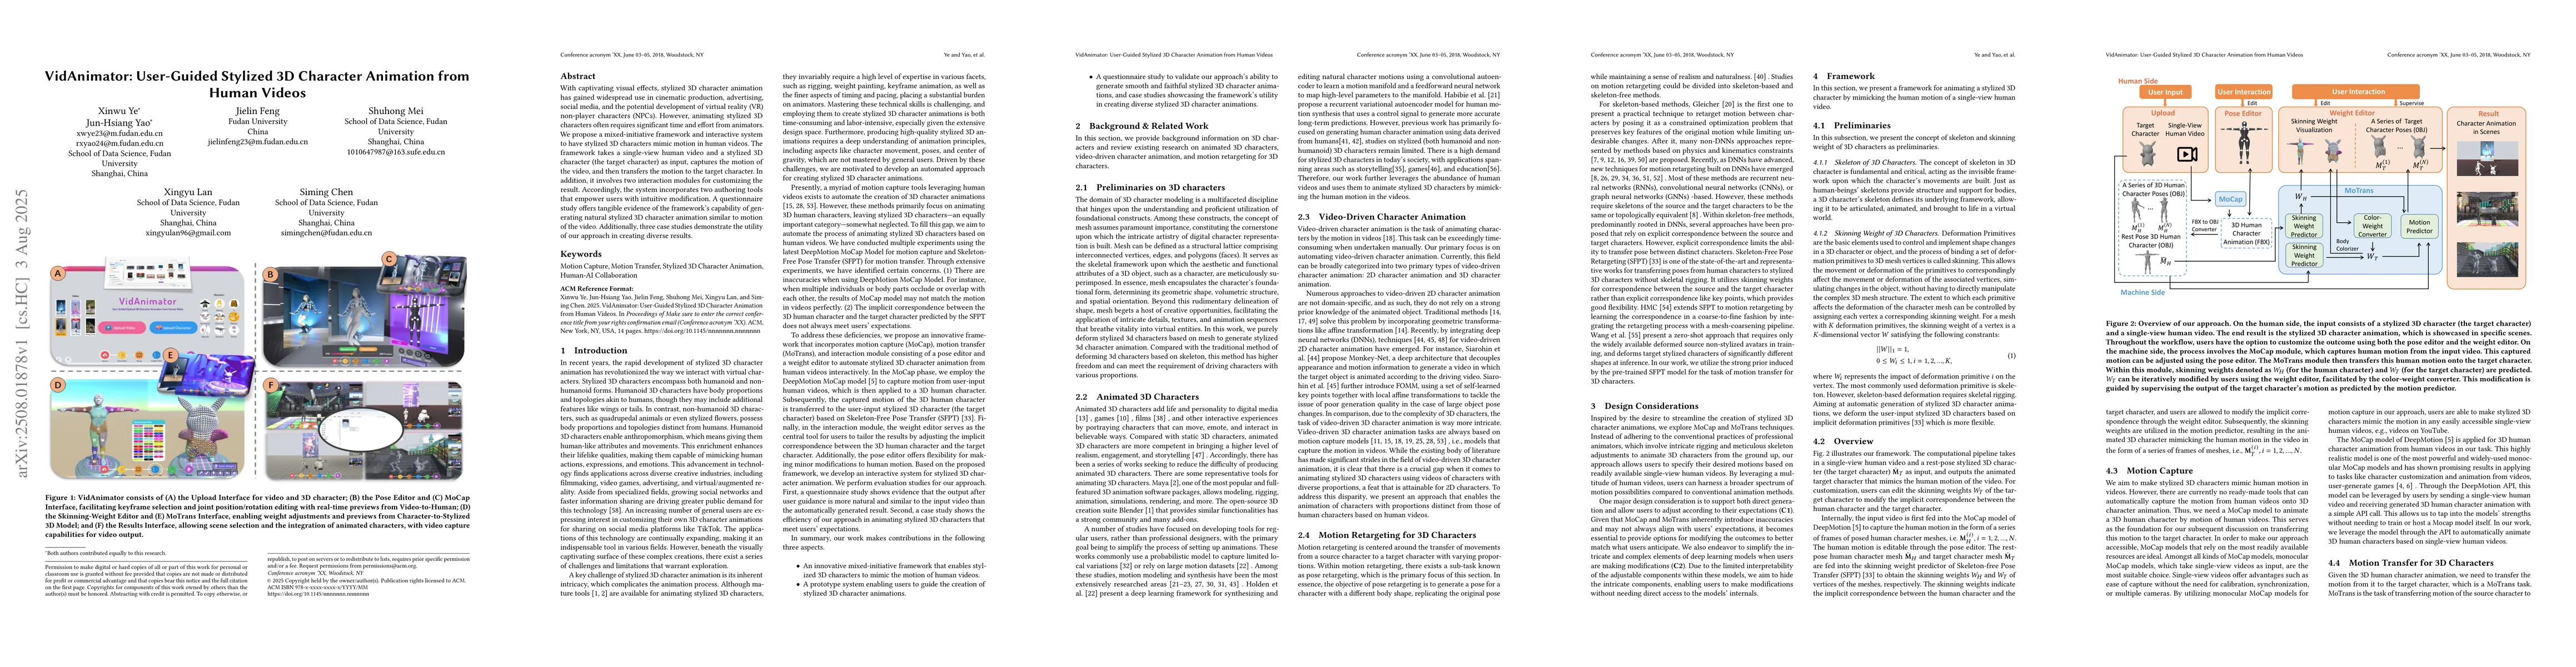
With captivating visual effects, stylized 3D character animation has gained widespread use in cinematic production, advertising, social media, and the potential development of virtual reality (VR) non...
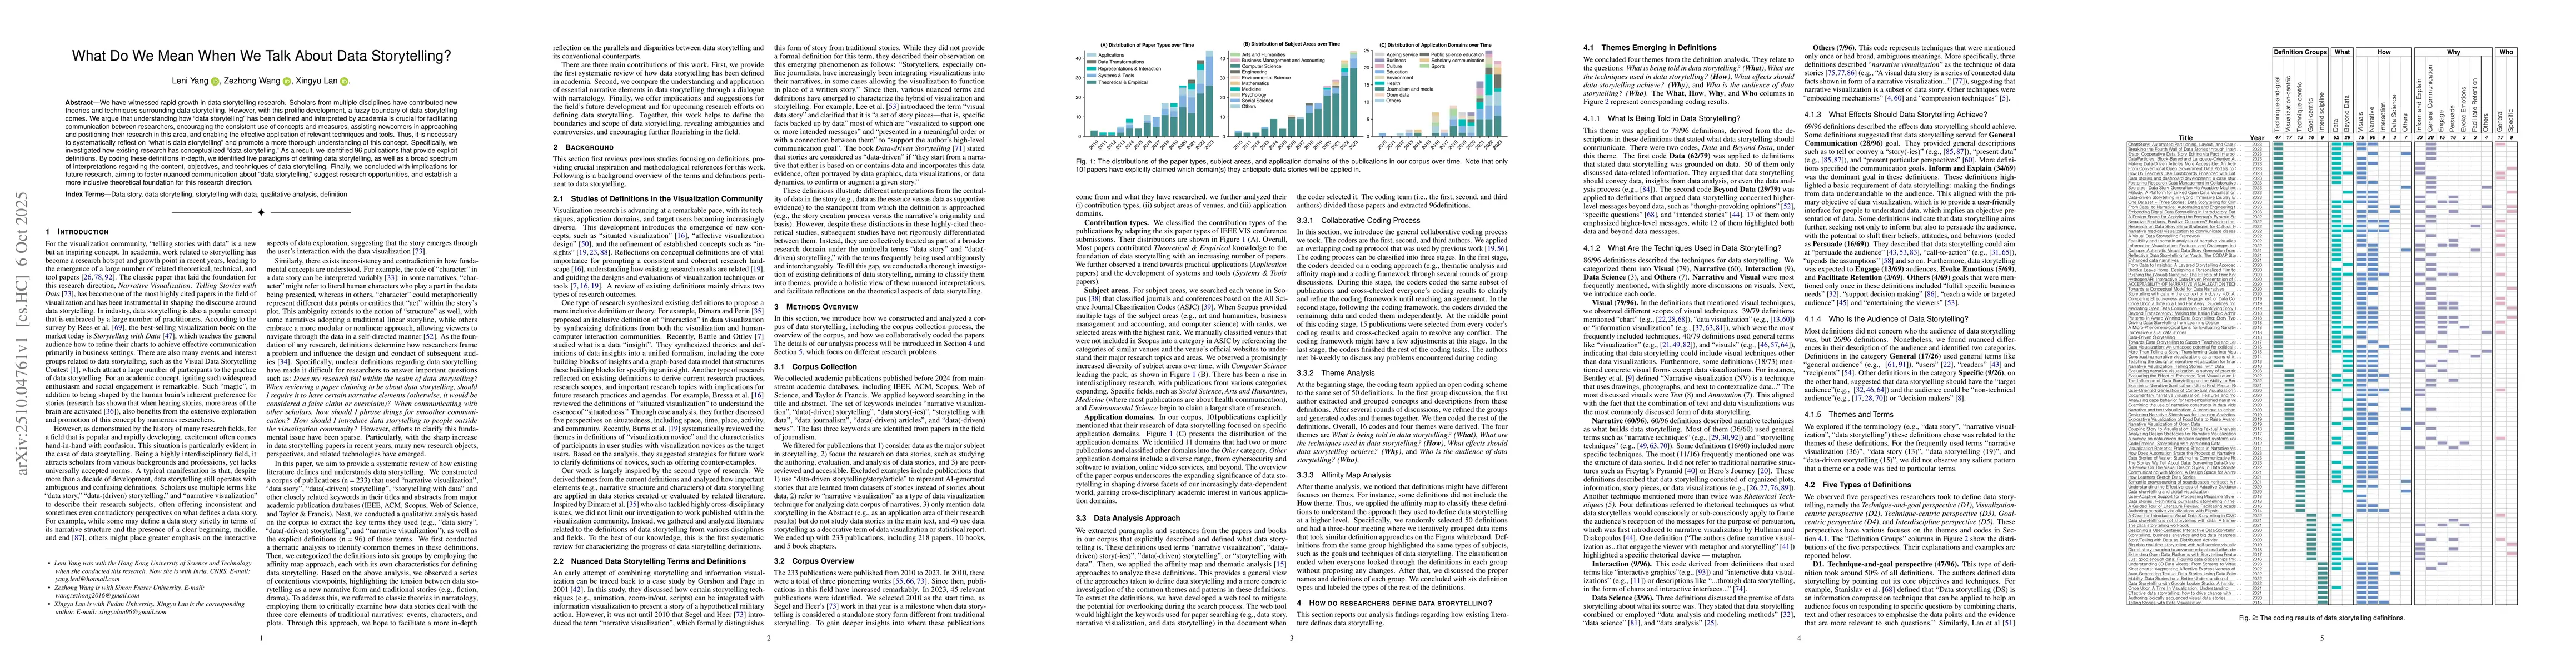
We have witnessed rapid growth in data storytelling research. Scholars from multiple disciplines have contributed new theories and techniques surrounding data storytelling. However, with this prolific...

Chatbots have become increasingly prevalent. A growing body of research focused on the issue of human trust in AI. However, most existing user studies are conducted primarily with adult groups, overlo...
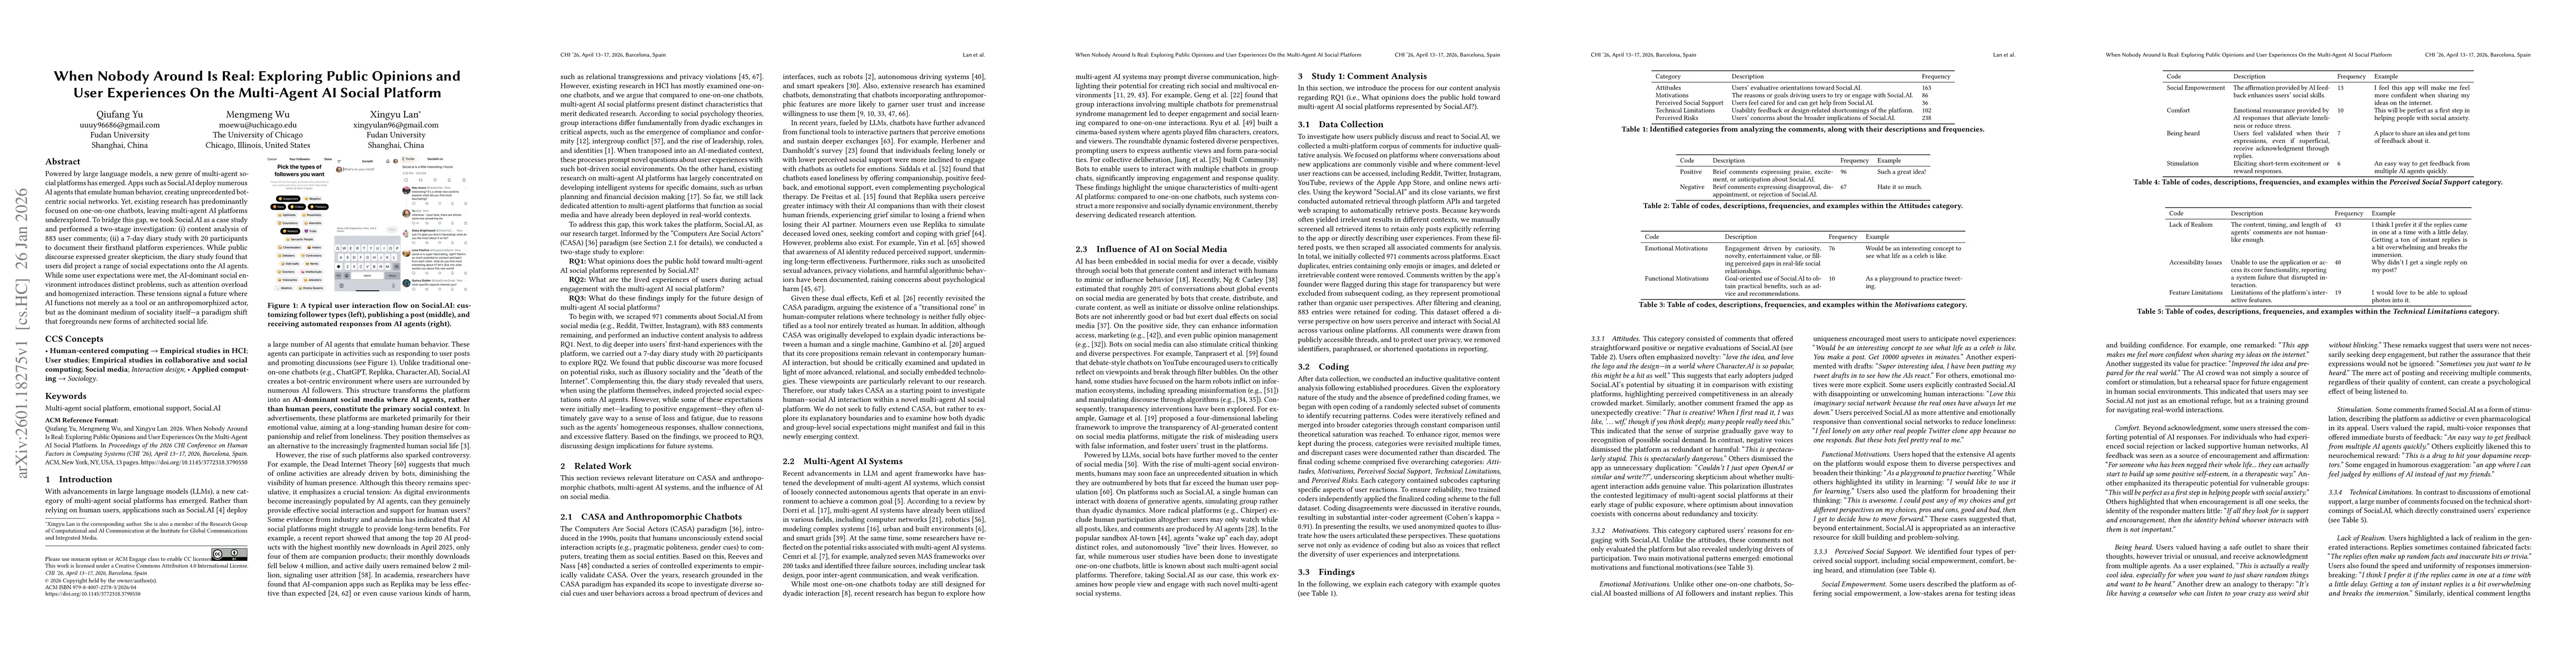
Powered by large language models, a new genre of multi-agent social platforms has emerged. Apps such as Social.AI deploy numerous AI agents that emulate human behavior, creating unprecedented bot-cent...

The sudden influx of "TikTok refugees'' into the Chinese platform RedNote in early 2025 created an unprecedented, large-scale online cross-cultural communication event between the West and East. Altho...
Generative AI has enabled ``Deadbots'', offering mourners an interactive way to engage with simulations of the deceased. While existing research often emphasizes ethics, less is known about how bereav...
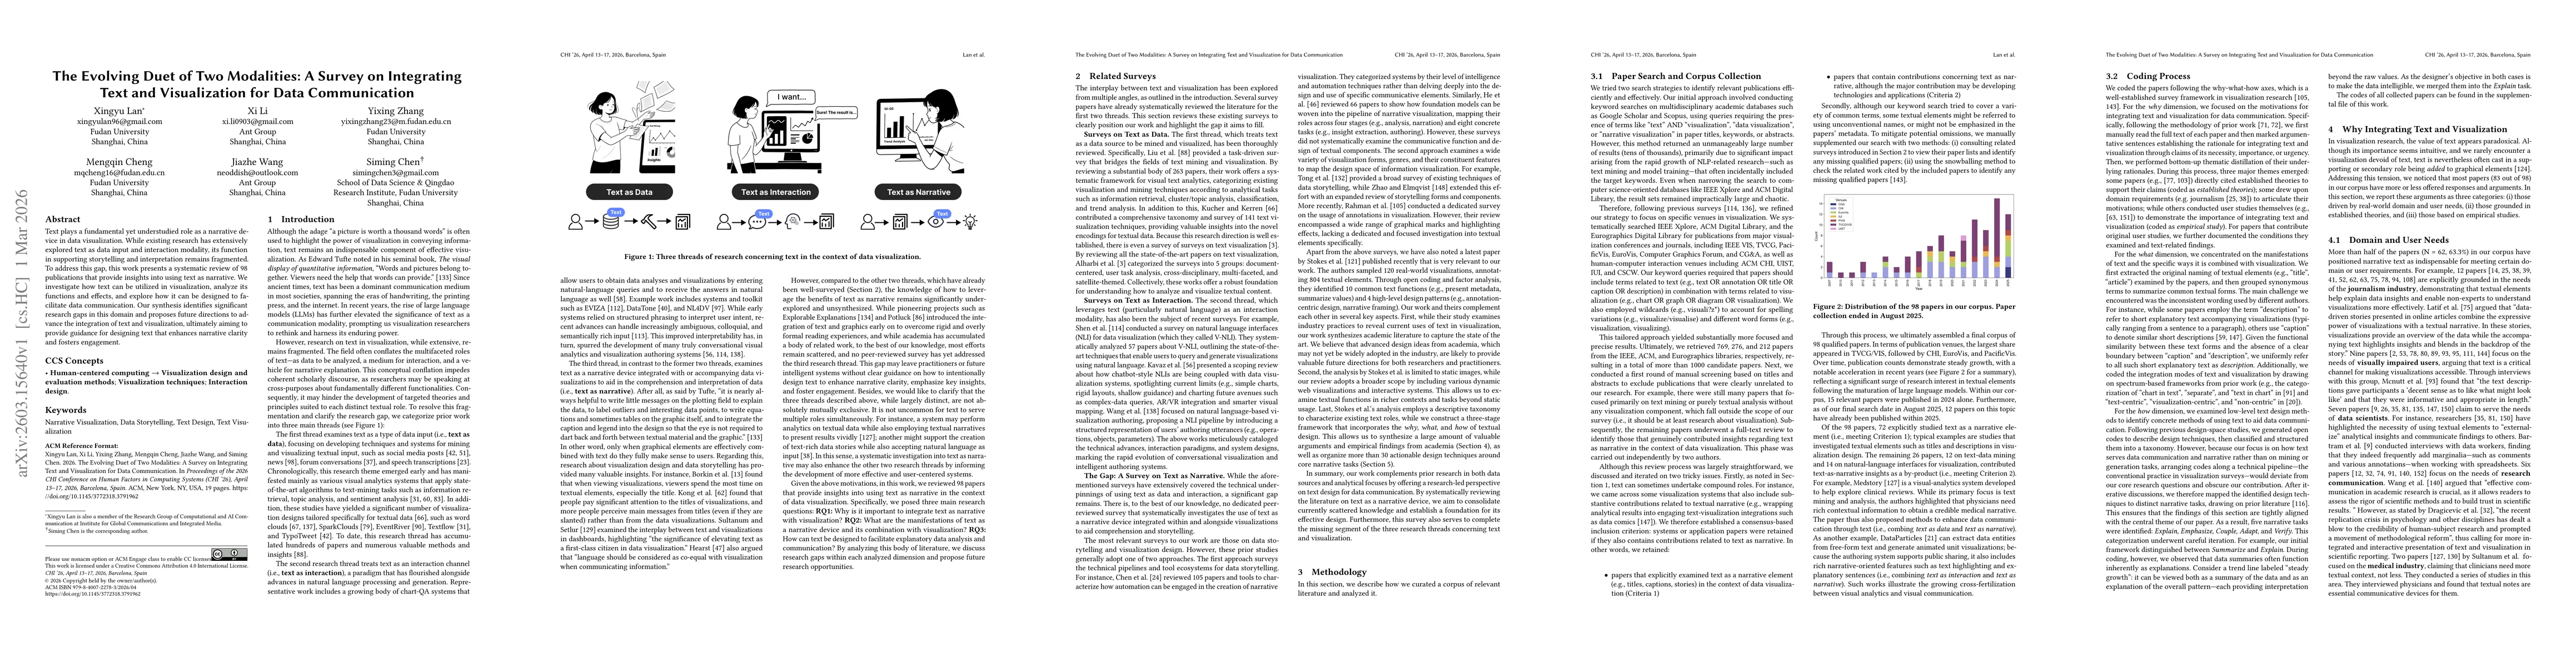
Text plays a fundamental yet understudied role as a narrative device in data visualization. While existing research has extensively explored text as data input and interaction modality, its function i...