VizBelle: A Design Space of Embellishments for Data Visualization
Publication
Metrics
AI Quick Summary
Title: VizBelle: A Design Space of Embellishments for Data Visualization Summary: VizBelle proposes a design space to aid data visualization designers in selecting appropriate embellishments, based on four dimensions: communication goal, object, strategy, and technique. A study involving 20 participants found the design space to be effective and illuminating for creating visually appealing visualizations.
Paper Preview
Abstract
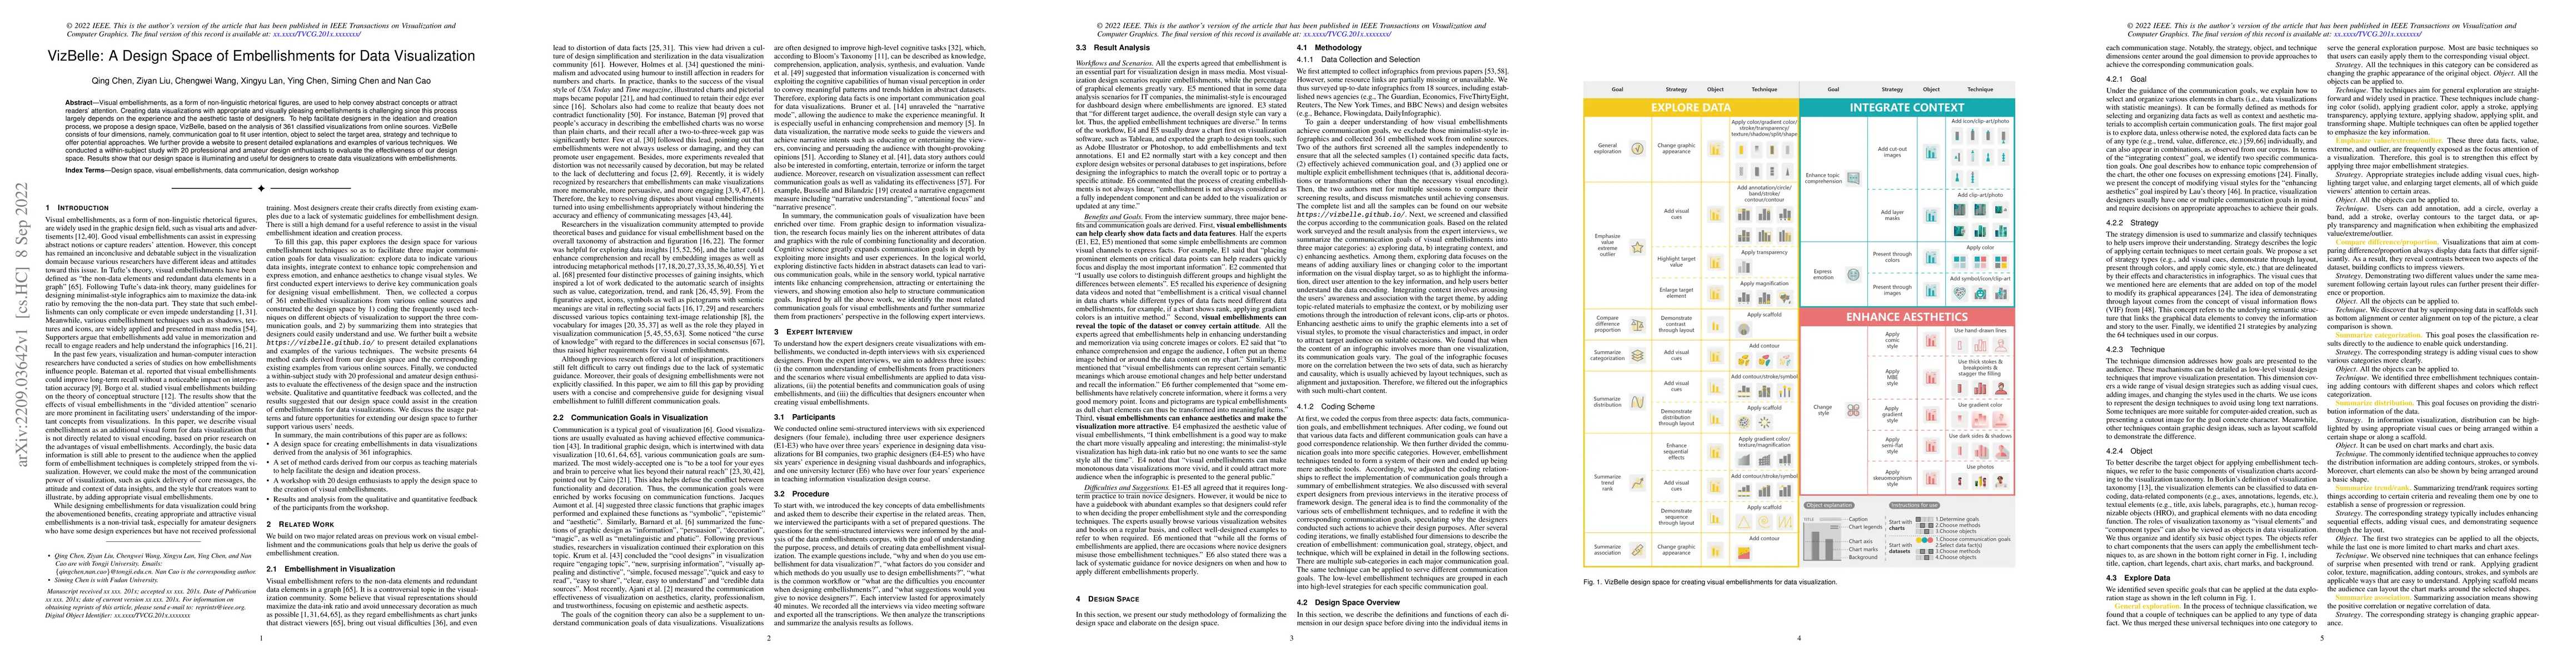
Visual embellishments, as a form of non-linguistic rhetorical figures, are used to help convey abstract concepts or attract readers' attention. Creating data visualizations with appropriate and visually pleasing embellishments is challenging since this process largely depends on the experience and the aesthetic taste of designers. To help facilitate designers in the ideation and creation process, we propose a design space, VizBelle, based on the analysis of 361 classified visualizations from online sources. VizBelle consists of four dimensions, namely, communication goal to fit user intention, object to select the target area, strategy and technique to offer potential approaches. We further provide a website to present detailed explanations and examples of various techniques. We conducted a within-subject study with 20 professional and amateur design enthusiasts to evaluate the effectiveness of our design space. Results show that our design space is illuminating and useful for designers to create data visualizations with embellishments.
AI Key Findings
Get AI-generated insights about this paper's methodology, results, significance, and more — seven facets brought into focus.
Impact
Paper Details
Authors
PDF Preview
Key Terms
Citation Network
Current paper (gray), citations (green), references (blue)
Display is limited for performance on very large graphs.
Discussion 0