This paper reviews literature on affective visualization design, identifying key research lines and clarifying their differences. It highlights five perspectives justifying the importance of emotion in visualization and explores the design space through 61 projects categorized by fields, tasks, and methods.
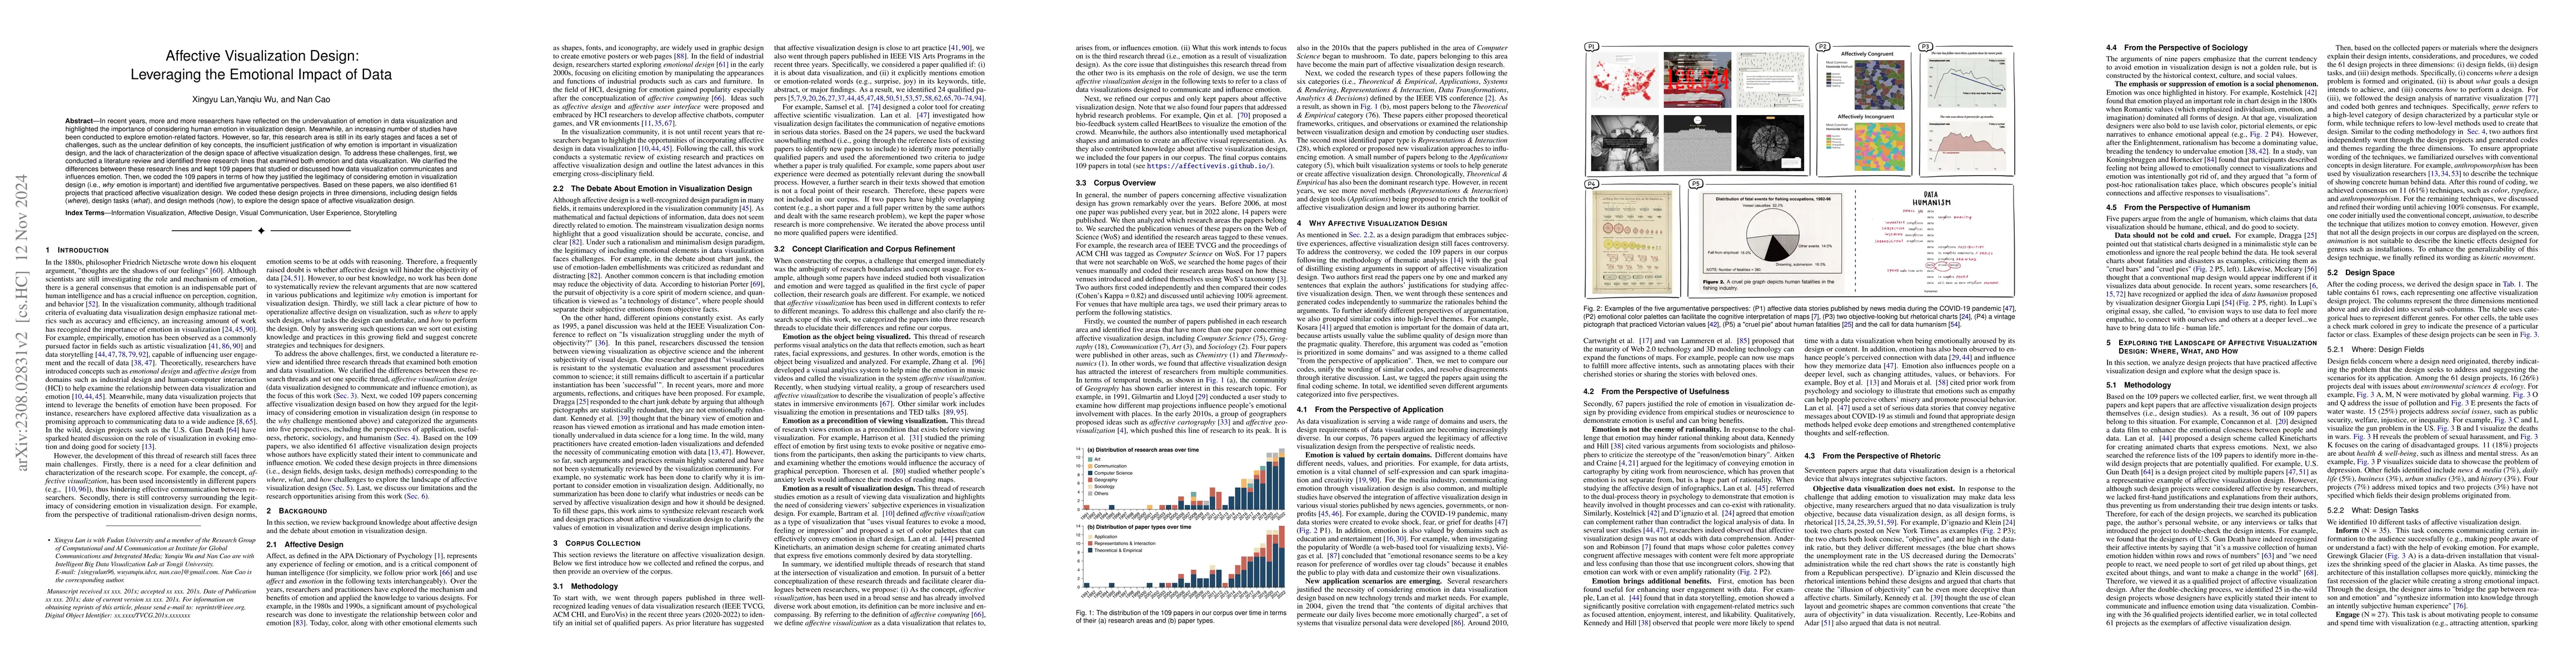
In recent years, more and more researchers have reflected on the undervaluation of emotion in data visualization and highlighted the importance of considering human emotion in visualization design. Meanwhile, an increasing number of studies have been conducted to explore emotion-related factors. However, so far, this research area is still in its early stages and faces a set of challenges, such as the unclear definition of key concepts, the insufficient justification of why emotion is important in visualization design, and the lack of characterization of the design space of affective visualization design. To address these challenges, first, we conducted a literature review and identified three research lines that examined both emotion and data visualization. We clarified the differences between these research lines and kept 109 papers that studied or discussed how data visualization communicates and influences emotion. Then, we coded the 109 papers in terms of how they justified the legitimacy of considering emotion in visualization design (i.e., why emotion is important) and identified five argumentative perspectives. Based on these papers, we also identified 61 projects that practiced affective visualization design. We coded these design projects in three dimensions, including design fields (where), design tasks (what), and design methods (how), to explore the design space of affective visualization design.
Get AI-generated insights about this paper's methodology, results, and significance.
Current paper (gray), citations (green), references (blue)
Nan Cao, Qing Chen, Xingyu Lan et al.
Valdemar Danry, Pat Pataranutaporn, Pattie Maes et al.
Title | Authors | Year | Actions |
---|---|---|---|
Design practices in visualization driven data exploration for non-expert audiences
|
Natasha Tylosky, Antti Knutas, Annika Wolff
|
2025
|
View Paper |
Toward Filling a Critical Knowledge Gap: Charting the Interactions of Age with Task and Visualization
|
Zack While, Ali Sarvghad
|
2025
|
View Paper |
Constructing AI ethics narratives based on real-world data: Human-AI collaboration in data-driven visual storytelling
|
Mengyi Wei, C. Jiao, Chenyu Zuo, L. Hurni, Liqiu Meng
|
2025
|
View Paper |
EmotionLens: Interactive visual exploration of the circumplex emotion space in literary works via affective word clouds
|
Bingyuan Wang, Qing Shi, Xiaohan Wang, You Zhou, Wei Zeng, Zeyu Wang
|
2025
|
View Paper |
Elevating Configurations of Data and Emotion: Dynamics of Coproduction, Collaboration and Competition
|
Kathryn Lanouette
|
2024
|
View Paper |
Telling Data Stories with the Hero's Journey: Design Guidance for Creating Data Videos
|
Zheng Wei, Huamin Qu, Xian Xu
|
2024
|
View Paper |
Entanglements for Visualization: Changing Research Outcomes through Feminist Theory
|
Derya Akbaba, Lauren Klein, Miriah Meyer
|
2024
|
View Paper |
Our Stories, Our Data: Co-designing Visualizations with People with Intellectual and Developmental Disabilities
|
Keke Wu, Ghulam Jilani Quadri, Arran Zeyu Wang, David Kwame Osei-Tutu, Emma Petersen, Varsha Koushik, D. Szafir
|
2024
|
View Paper |
Visualization Atlases: Explaining and Exploring Complex Topics Through Data, Visualization, and Narration
|
Jinrui Wang, Xinhuan Shu, Benjamin Bach, Uta Hinrichs
|
2024
|
View Paper |
Mind Drifts, Data Shifts: Utilizing Mind Wandering to Track the Evolution of User Experience with Data Visualizations
|
Anjana Arunkumar, Lace Padilla, Chris Bryan
|
2024
|
View Paper |
DanModCap: Designing a Danmaku Moderation Tool for Video-Sharing Platforms that Leverages Impact Captions
|
Siying Hu, Huanchen Wang, Yu Zhang, Pi-Hui Wang, Zhicong Lu
|
2024
|
View Paper |
Interactive data comics for communicating medical data to the general public: A study of engagement and ease of understanding
|
Melissa Fogwill, A. Manataki
|
2024
|
View Paper |
What Can Interactive Visualization Do for Participatory Budgeting in Chicago?
|
Alex Kale, Danni Liu, Maria Gabriela Ayala, Harper Schwab, Andrew McNutt
|
2024
|
View Paper |
Quantifying Emotional Responses to Immutable Data Characteristics and Designer Choices in Data Visualizations
|
Carter Blair, Xiyao Wang, Charles Perin
|
2024
|
View Paper |
The Language of Infographics: Toward Understanding Conceptual Metaphor Use in Scientific Storytelling
|
Hana Pokojná, Tobias Isenberg, Stefan Bruckner, Barbora Kozlíková, L. Garrison
|
2024
|
View Paper |
“I Came Across a Junk”: Understanding Design Flaws of Data Visualization from the Public's Perspective
|
Xingyu Lan, Yu Liu
|
2024
|
View Paper |
FaceVis: Exploring a Robot's Face for Affective Visualisation Design
|
Sarah Schömbs, Jiahe Pan, Yan Zhang, Jorge Gonçalves, W. Johal
|
2024
|
View Paper |
Personalizing Products with Stylized Head Portraits for Self-Expression
|
Yang Shi, Yechun Peng, Shengqi Dang, Nanxuan Zhao, Nan Cao
|
2024
|
View Paper |
Watching the Election Sausage Get Made: How Data Journalists Visualize the Vote Counting Process in U.S. Elections
|
Mandi Cai, Matthew Kay
|
2024
|
View Paper |
Input Visualization: Collecting and Modifying Data with Visual Representations
|
Nathalie Bressa, Jordan Louis, Wesley Willett, Samuel Huron
|
2024
|
View Paper |
Gen4DS: Workshop on Data Storytelling in an Era of Generative AI
|
Xingyu Lan, Leni Yang, Zezhong Wang, Yun Wang, Danqing Shi, Sheelagh Carpendale
|
2024
|
View Paper |
An Image-based Typology for Visualization
|
Jian Chen, Petra Isenberg, R. Laramee, Tobias Isenberg, Michael Sedlmair, Torsten Moeller, Rui Li
|
2024
|
View Paper |
Leveraging Foundation Models for Crafting Narrative Visualization: A Survey.
|
Yi He, Ke Xu, Shixiong Cao, Yang Shi, Qing Chen, Nan Cao
|
2024
|
View Paper |
The Gulf of Interpretation: From Chart to Message and Back Again
|
Christian Knoll, T. Möller, Kathleen Gregory, Laura Koesten
|
2023
|
View Paper |
Untangling Rhetoric, Pathos, and Aesthetics in Data Visualization
|
Verena Ingrid Prantl, Torsten Moeller, Laura Koesten
|
2023
|
View Paper |
VAID: Indexing View Designs in Visual Analytics System
|
Lu Ying, Aoyu Wu, Haotian Li, Zikun Deng, Ji Lan, Jiang Wu, Yong Wang, Huamin Qu, Dazhen Deng, Yingcai Wu
|
2022
|
View Paper |
Limits at a Distance: Design Directions to Address Psychological Distance in Policy Decisions Affecting Planetary Boundaries
|
Eshta Bhardwaj
|
View Paper | |
DanModCap: Designing a Danmaku Moderation Tool for Video-Sharing Platforms that Leverages Impact Captions
|
View Paper |
Comments (0)