The Chart Excites Me! Exploring How Data Visualization Design Influences Affective Arousal
Publication
Metrics
AI Quick Summary
This paper explores how specific design features in data visualizations influence viewers' affective arousal. Through a study involving 184 participants rating 265 visualizations, the researchers identified four key design features—colorfulness and the use of multiple visual channels—that significantly contribute to emotional arousal.
Paper Preview
Abstract
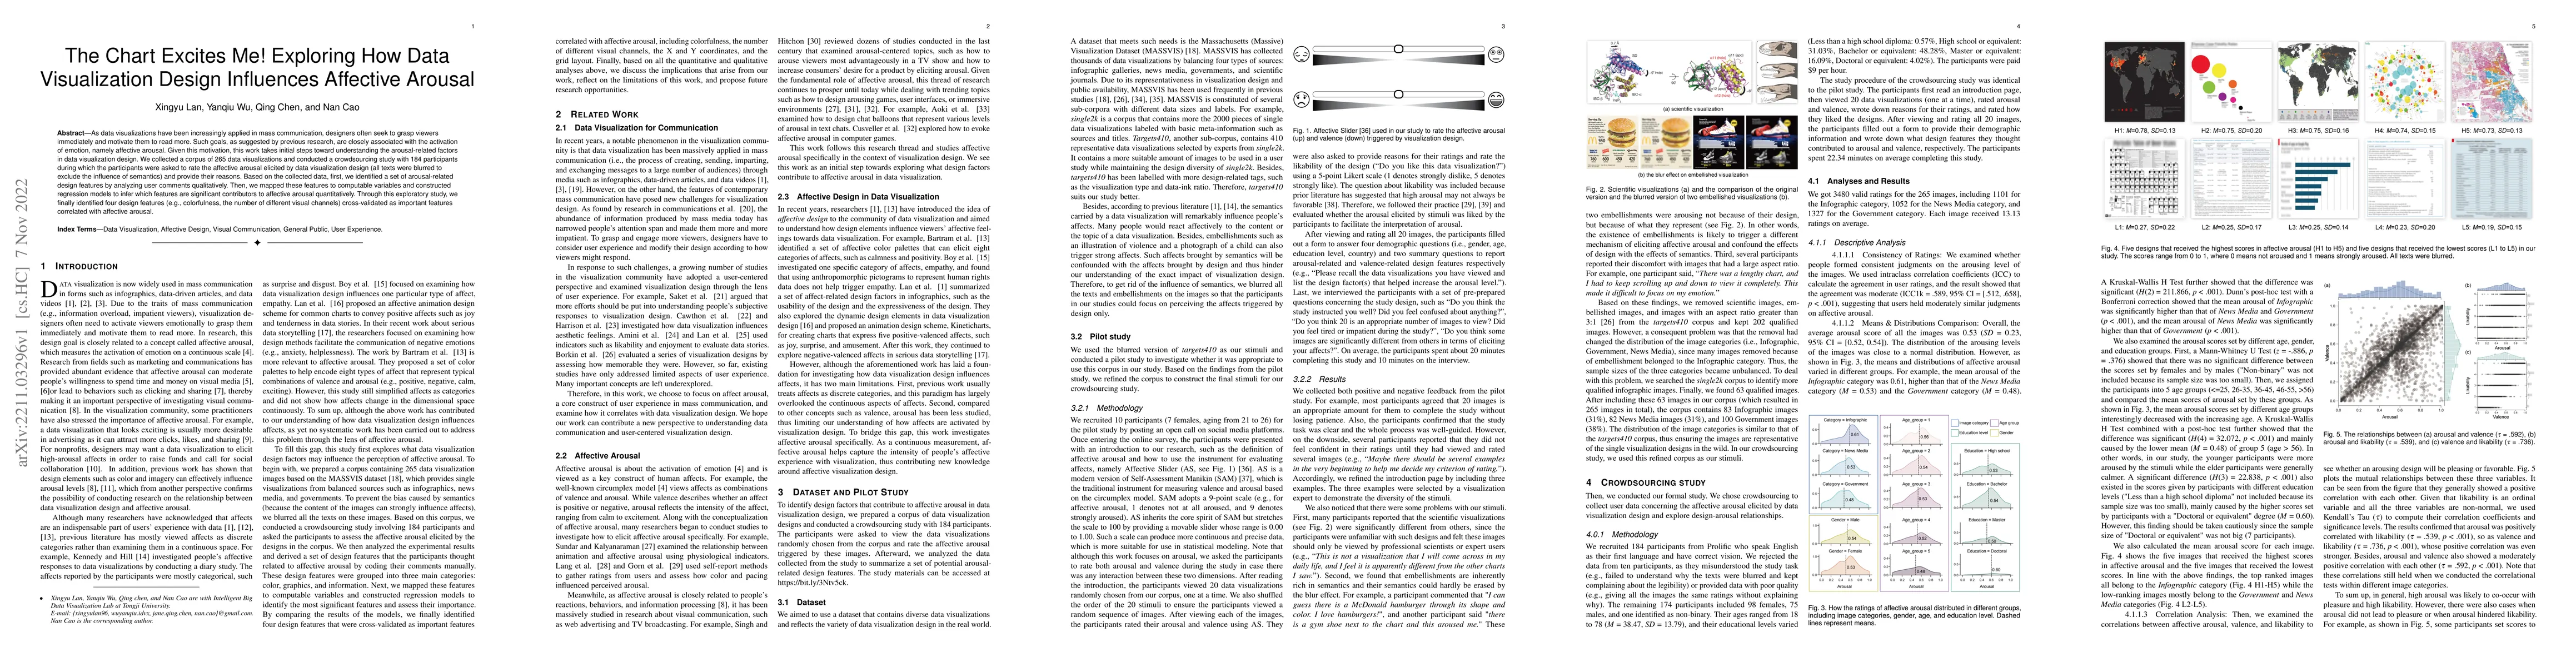
As data visualizations have been increasingly applied in mass communication, designers often seek to grasp viewers immediately and motivate them to read more. Such goals, as suggested by previous research, are closely associated with the activation of emotion, namely affective arousal. Given this motivation, this work takes initial steps toward understanding the arousal-related factors in data visualization design. We collected a corpus of 265 data visualizations and conducted a crowdsourcing study with 184 participants during which the participants were asked to rate the affective arousal elicited by data visualization design (all texts were blurred to exclude the influence of semantics) and provide their reasons. Based on the collected data, first, we identified a set of arousal-related design features by analyzing user comments qualitatively. Then, we mapped these features to computable variables and constructed regression models to infer which features are significant contributors to affective arousal quantitatively. Through this exploratory study, we finally identified four design features (e.g., colorfulness, the number of different visual channels) cross-validated as important features correlated with affective arousal.
AI Key Findings
Get AI-generated insights about this paper's methodology, results, significance, and more — seven facets brought into focus.
Impact
Paper Details
Authors
PDF Preview
Key Terms
Citation Network
Current paper (gray), citations (green), references (blue)
Display is limited for performance on very large graphs.
Discussion 0