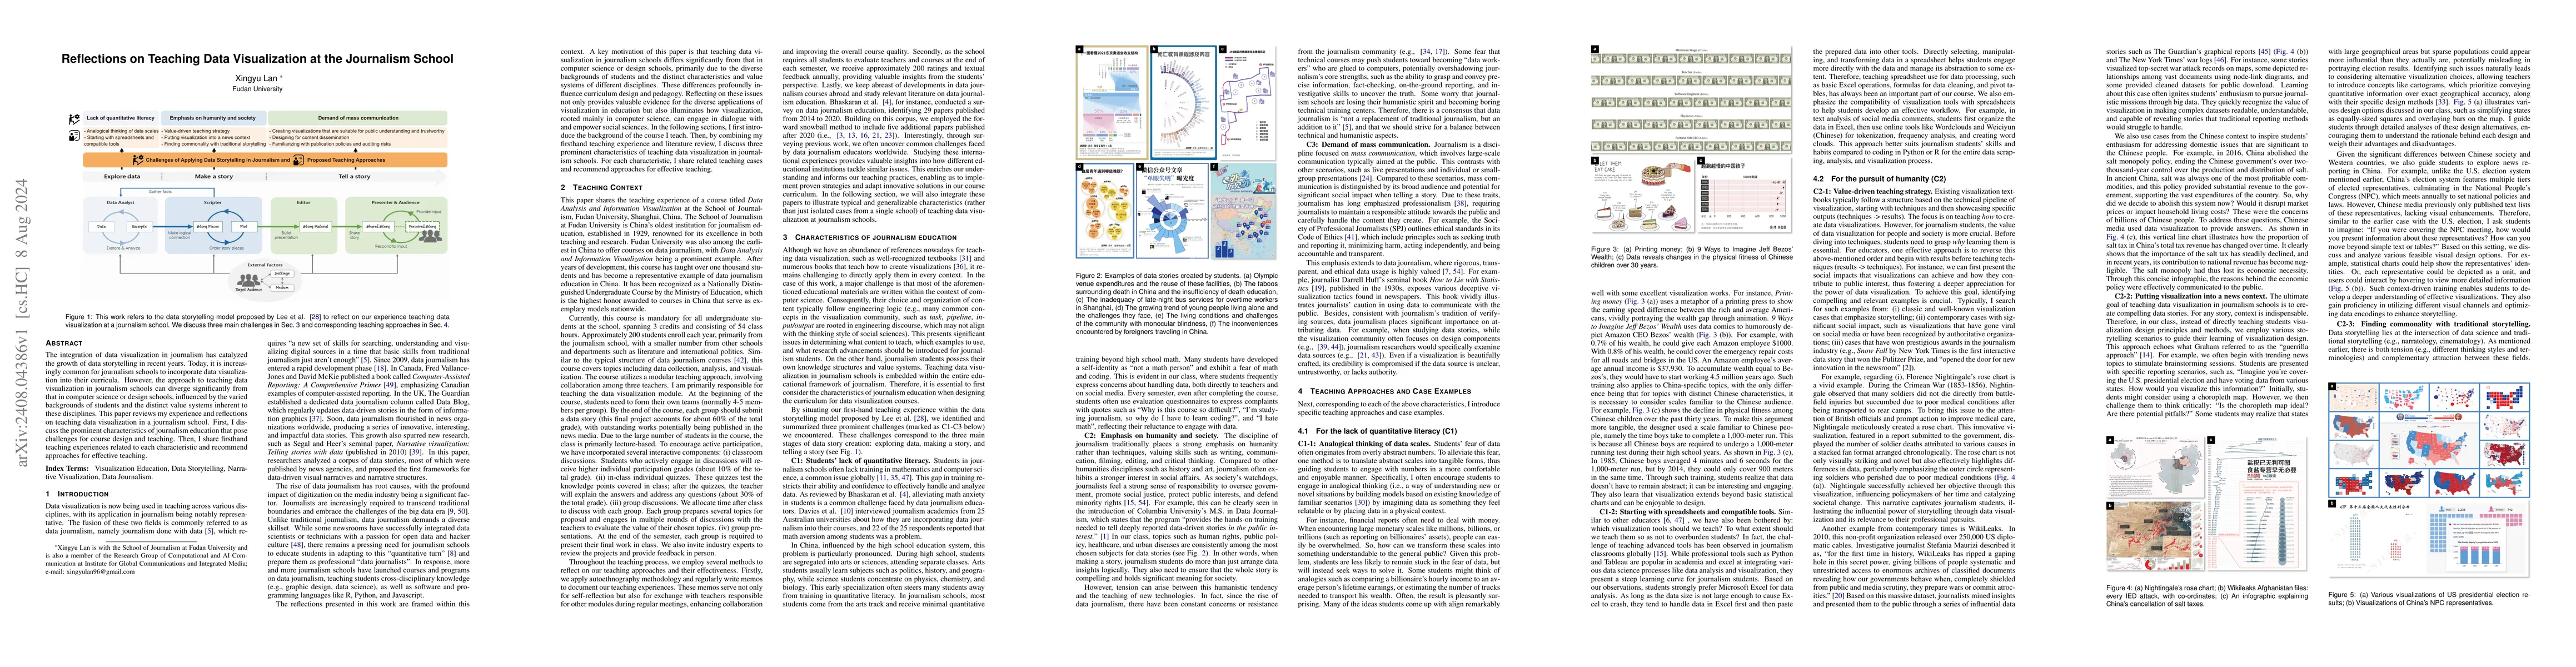
Reflections on Teaching Data Visualization at the Journalism School
Publication
Metrics
AI Quick Summary
This paper reflects on the unique challenges and effective teaching strategies for integrating data visualization into journalism school curricula, highlighting the distinct needs stemming from journalism students' varied backgrounds and the discipline's value systems. The author shares firsthand experiences and recommends tailored approaches for successful data visualization instruction.
Paper Preview
Abstract
The integration of data visualization in journalism has catalyzed the growth of data storytelling in recent years. Today, it is increasingly common for journalism schools to incorporate data visualization into their curricula. However, the approach to teaching data visualization in journalism schools can diverge significantly from that in computer science or design schools, influenced by the varied backgrounds of students and the distinct value systems inherent to these disciplines. This paper reviews my experience and reflections on teaching data visualization in a journalism school. First, I discuss the prominent characteristics of journalism education that pose challenges for course design and teaching. Then, I share firsthand teaching experiences related to each characteristic and recommend approaches for effective teaching.
AI Key Findings
Get AI-generated insights about this paper's methodology, results, significance, and more — seven facets brought into focus.
Authors
PDF Preview
Related Papers
No references found for this paper.
Discussion 0