Publication
Metrics
AI Quick Summary
Research identifies business sectors from stock price fluctuations using cross-correlation matrices, partitioning stocks into distinct subsets that mirror conventional business sectors with stability over time. These sectors can help investors find risk-free investments with a given return.
Paper Preview
Abstract
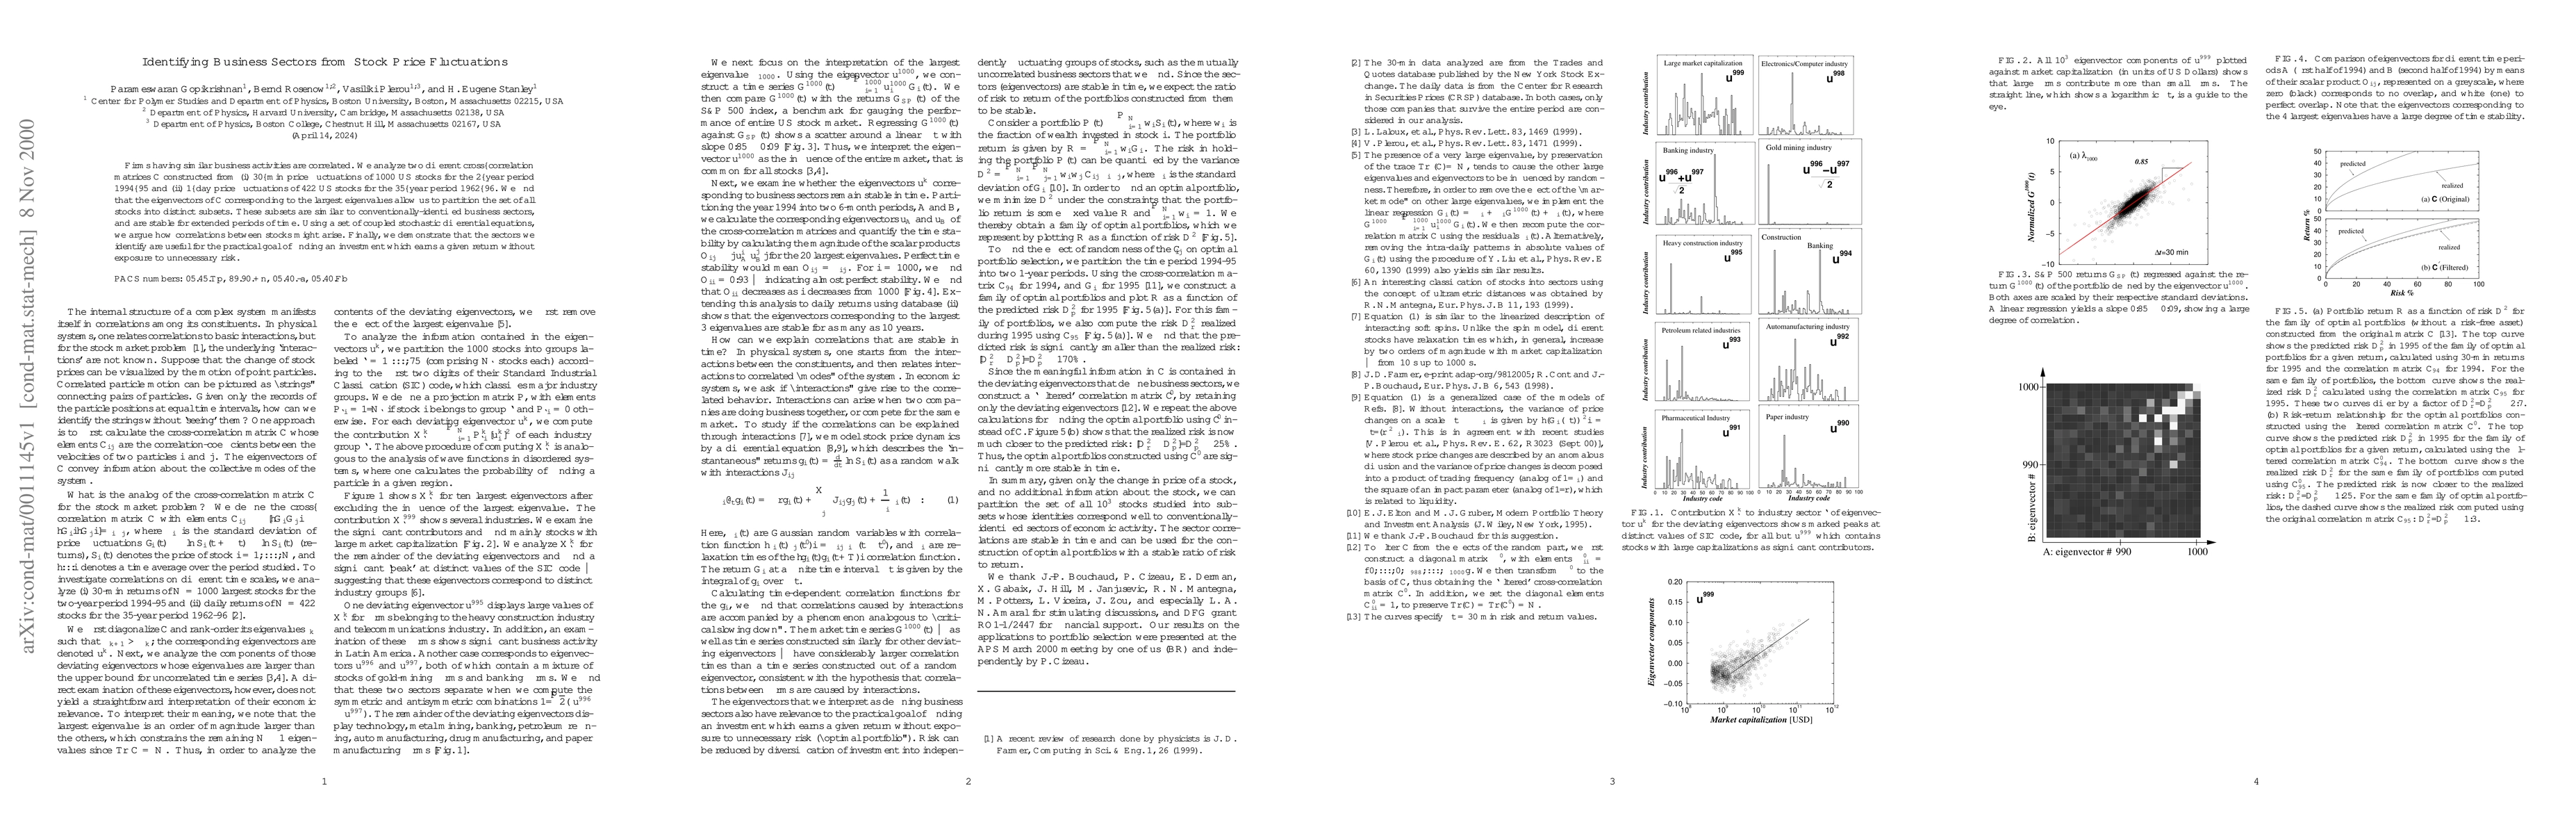
Firms having similar business activities are correlated. We analyze two different cross-correlation matrices C constructed from (i) 30-min price fluctuations of 1000 US stocks for the 2-year period 1994-95 and (ii) 1-day price fluctuations of 422 US stocks for the 35-year period 1962-96. We find that the eigenvectors of C corresponding to the largest eigenvalues allow us to partition the set of all stocks into distinct subsets. These subsets are similar to conventionally-identified business sectors, and are stable for extended periods of time. Using a set of coupled stochastic differential equations, we argue how correlations between stocks might arise. Finally, we demonstrate that the sectors we identify are useful for the practical goal of finding an investment which earns a given return without exposure to unnecessary risk.
AI Key Findings
Get AI-generated insights about this paper's methodology, results, significance, and more — seven facets brought into focus.
Discussion 0