Publication
Metrics
AI Quick Summary
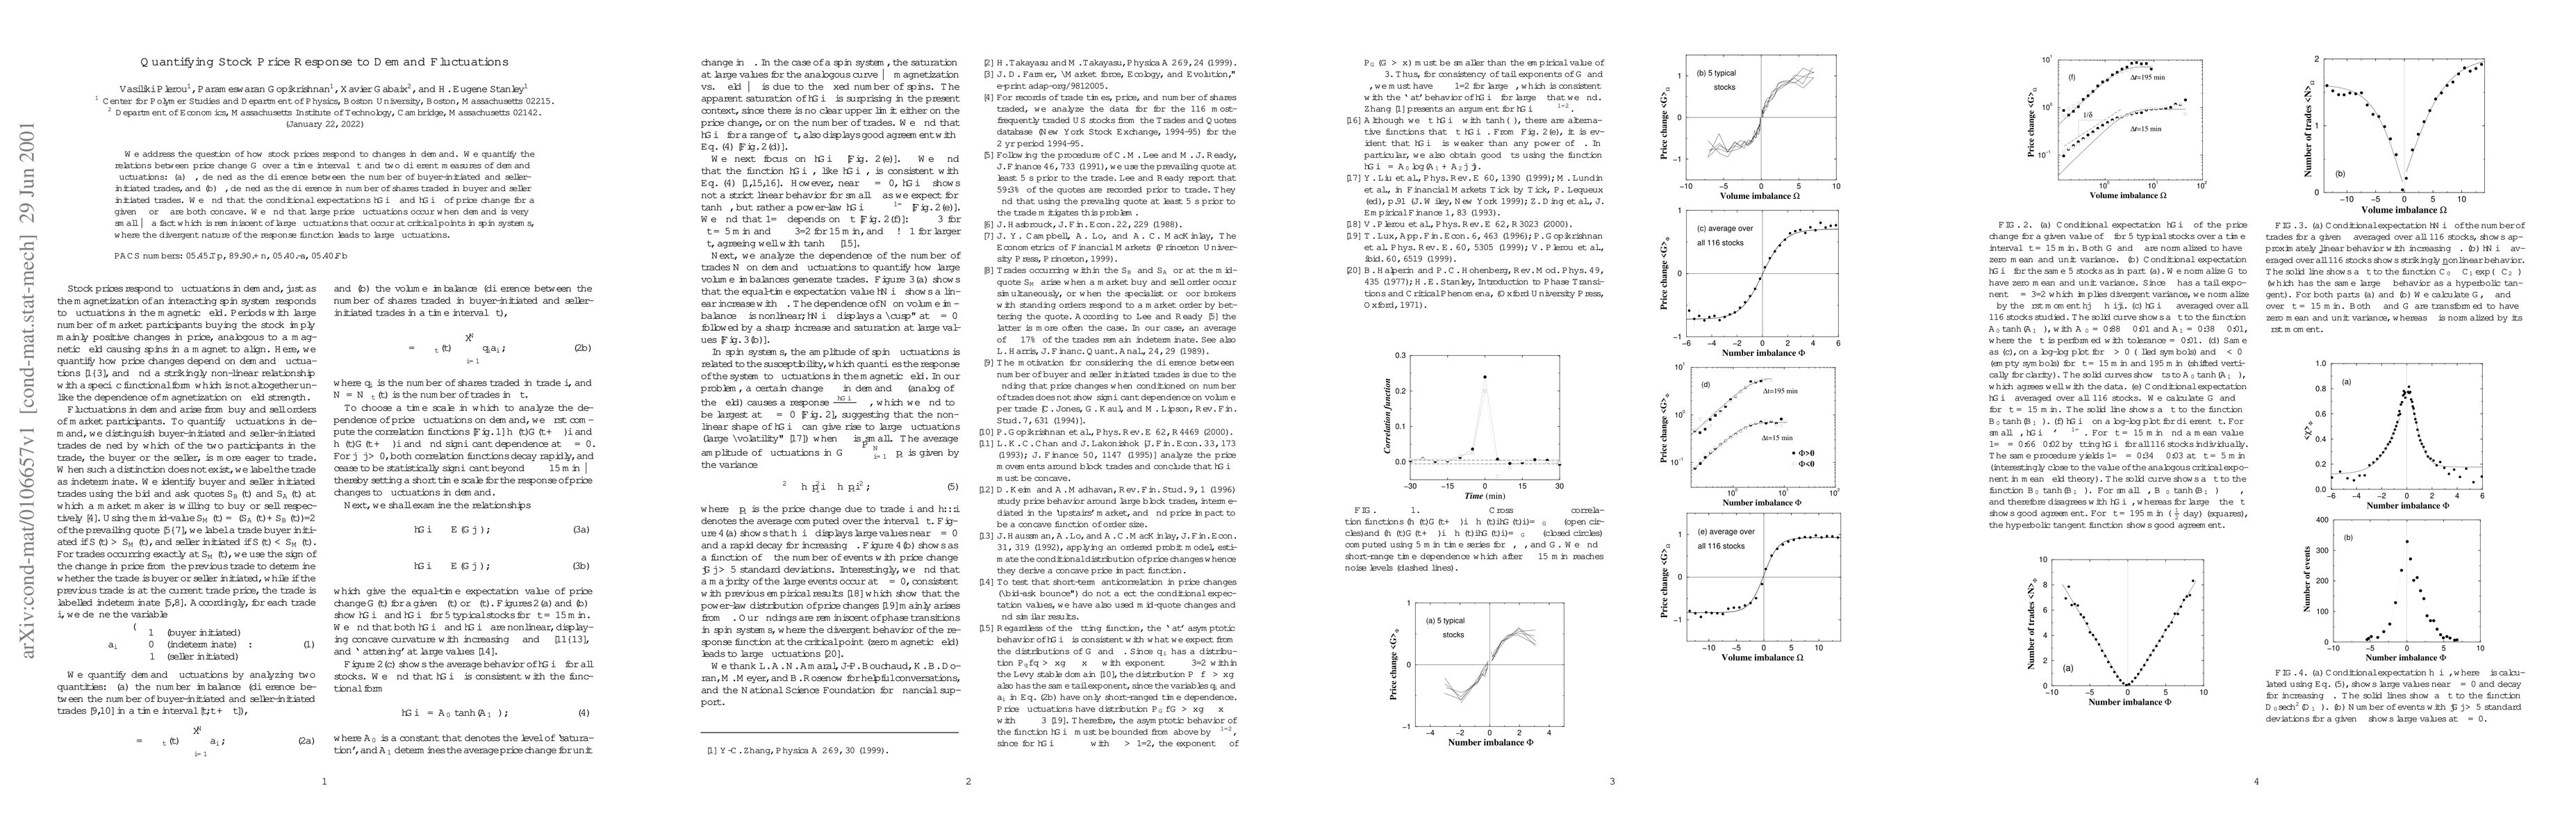
This paper quantifies how stock prices respond to fluctuations in demand, measuring changes in price ($G$) relative to two demand metrics ($\Phi$ and $\Omega$). It finds that both measures lead to concave conditional expectations of price changes, with large price fluctuations occurring when demand is minimal, akin to critical points in spin systems.
Paper Preview
Abstract
We address the question of how stock prices respond to changes in demand. We quantify the relations between price change $G$ over a time interval $\Delta t$ and two different measures of demand fluctuations: (a) $\Phi$, defined as the difference between the number of buyer-initiated and seller-initiated trades, and (b) $\Omega$, defined as the difference in number of shares traded in buyer and seller initiated trades. We find that the conditional expectations $
AI Key Findings
Get AI-generated insights about this paper's methodology, results, significance, and more — seven facets brought into focus.
Impact
Paper Details
PDF Preview
Citation Network
Current paper (gray), citations (green), references (blue)
Display is limited for performance on very large graphs.
Discussion 0