Publication

Published: Jan 24, 2024
Categories: stat.CO

Metrics

Source: ArXiv

Quick Actions

View PDF

AI Quick Summary

This paper reviews multivariate statistical methods for visualizing correlation matrices, proposing a weighted alternating least squares approach that outperforms principal component analysis and principal factor analysis. The authors further enhance this method with an additive adjustment to achieve an even better approximation of the correlation matrix.

Quick Answers

What is "Improved approximation and visualization of the correlation matrix" about?

This paper reviews multivariate statistical methods for visualizing correlation matrices, proposing a weighted alternating least squares approach that outperforms principal component analysis and principal factor analysis. The authors further enhance this method with an additive adjustment to achieve an even better approximation of the correlation matrix.

What methodology did the authors use?

The paper reviews and compares multivariate statistical methods for visualizing correlation matrices, focusing on principal component analysis (PCA), weighted alternating least squares (WALS), and other techniques. It proposes an improved representation using WALS and an additive adjustment. More in Methodology →

What are the key results?

WALS outperforms PCA and principal factor analysis in approximating a correlation matrix. — WALS, especially with an adjusted correlation matrix, provides the best approximation to the correlation matrix, often with minimal loss in explained variance. More in Key Results →

Why is this work significant?

This research is significant as it introduces an improved method for visualizing and approximating correlation matrices, which is crucial in multivariate data analysis for various fields including genomics, finance, and social sciences. More in Significance →

What are the main limitations?

The study is limited to a specific example dataset (Heart attack data) and may not generalize to all types of datasets. — The paper does not extensively discuss computational complexities or scalability of the proposed method with very large datasets. More in Limitations →

Paper Preview

Abstract

The graphical representation of the correlation matrix by means of different multivariate statistical methods is reviewed, a comparison of the different procedures is presented with the use of an example data set, and an improved representation with better fit is proposed. Principal component analysis is widely used for making pictures of correlation structure, though as shown a weighted alternating least squares approach that avoids the fitting of the diagonal of the correlation matrix outperforms both principal component analysis and principal factor analysis in approximating a correlation matrix. Weighted alternating least squares is a very strong competitor for principal component analysis, in particular if the correlation matrix is the focus of the study, because it improves the representation of the correlation matrix, often at the expense of only a minor percentage of explained variance for the original data matrix, if the latter is mapped onto the correlation biplot by regression. In this article, we propose to combine weighted alternating least squares with an additive adjustment of the correlation matrix, and this is seen to lead to further improved approximation of the correlation matrix.
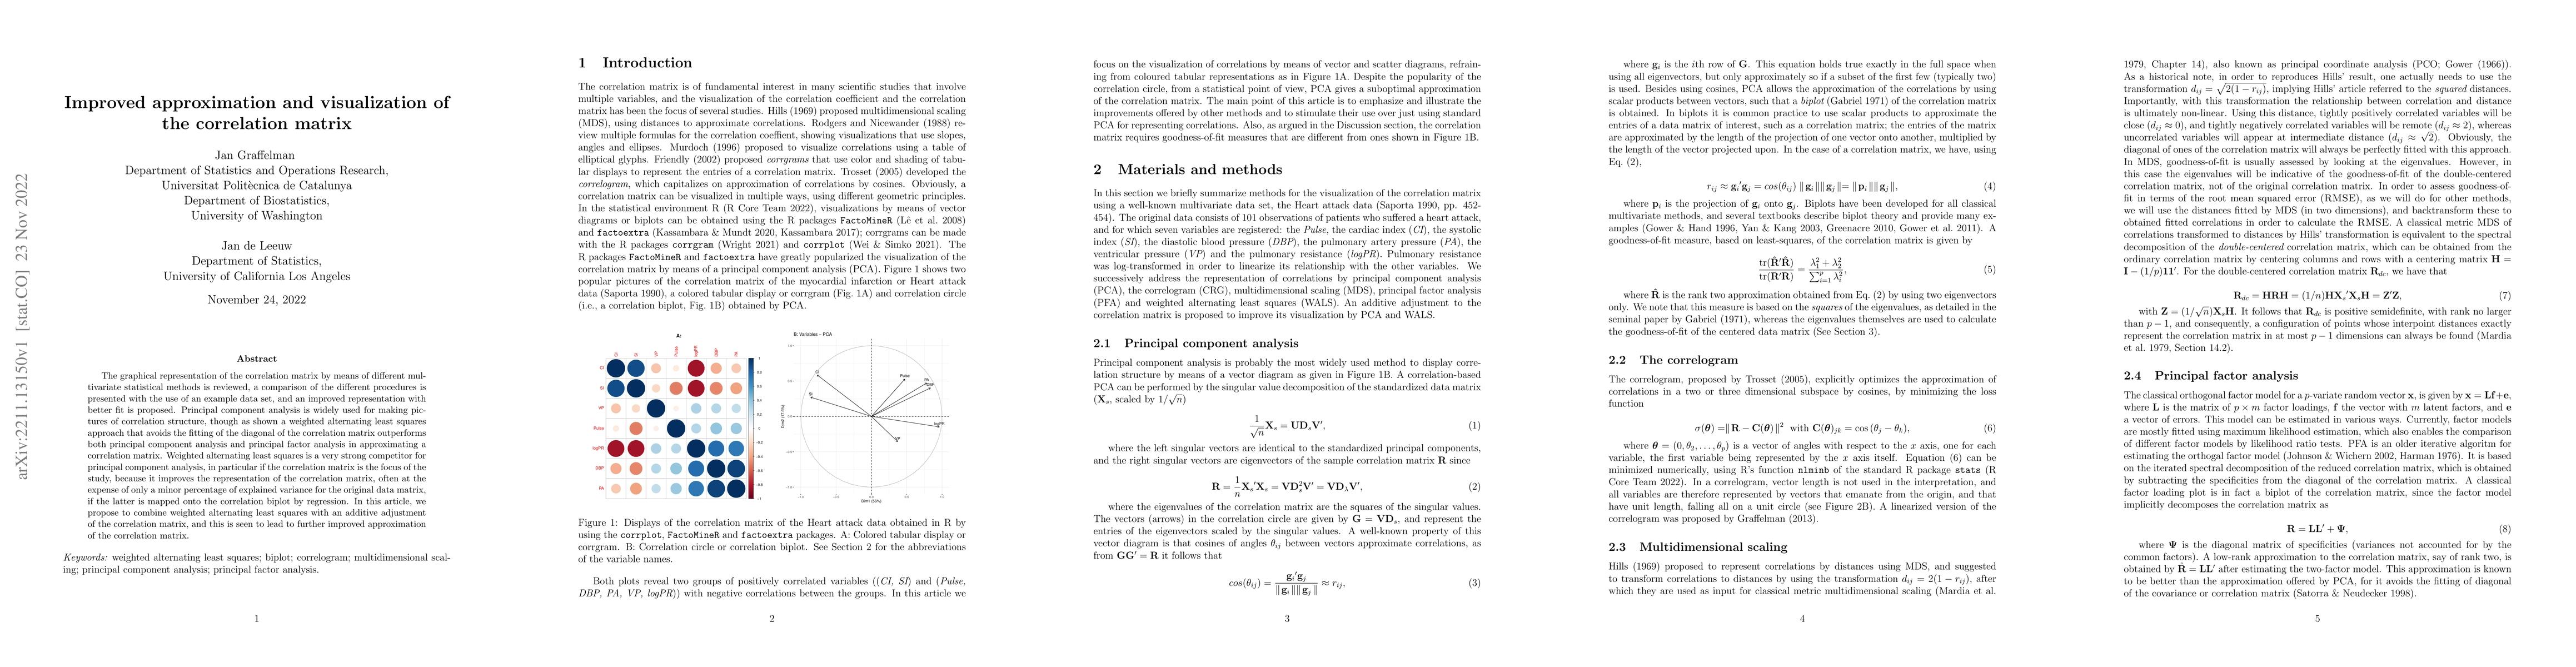
AI Key Findings

Generated Sep 03, 2025

Methodology — What approach did the authors take?

The paper reviews and compares multivariate statistical methods for visualizing correlation matrices, focusing on principal component analysis (PCA), weighted alternating least squares (WALS), and other techniques. It proposes an improved representation using WALS and an additive adjustment.

Key Results — What are the main findings?

  • WALS outperforms PCA and principal factor analysis in approximating a correlation matrix.
  • WALS, especially with an adjusted correlation matrix, provides the best approximation to the correlation matrix, often with minimal loss in explained variance.
  • The proposed method significantly reduces the root mean square error (RMSE) of off-diagonal elements in the correlation matrix compared to PCA and other methods.

Significance — Why does this research matter?

This research is significant as it introduces an improved method for visualizing and approximating correlation matrices, which is crucial in multivariate data analysis for various fields including genomics, finance, and social sciences.

Technical Contribution — What is the technical contribution?

The paper presents a weighted alternating least squares method combined with an additive adjustment for approximating and visualizing correlation matrices, which outperforms traditional PCA and principal factor analysis.

Novelty — What is new about this work?

The novelty of this work lies in proposing an improved representation of correlation matrices using WALS that avoids fitting the diagonal, combined with an additive adjustment, resulting in a lower RMSE and better fit compared to existing methods.

Limitations — What are the limitations of this study?

  • The study is limited to a specific example dataset (Heart attack data) and may not generalize to all types of datasets.
  • The paper does not extensively discuss computational complexities or scalability of the proposed method with very large datasets.

Future Work — What did the authors propose for future work?

  • Further investigation into the performance of the proposed method on diverse datasets from different domains.
  • Exploring the computational efficiency and scalability of the method for big data applications.

Paper Details

Paper ID: 2211.13150
Journal: The American Statistitician, 2023, 77(4) pp. 432--442
License: http://creativecommons.org/licenses/by-nc-nd/4.0/
Comments: 20 pages, 4 figures
Categories:
stat.CO

How to Cite This Paper

BibTeX
@article{leeuw2024improved,
  title         = {Improved approximation and visualization of the correlation matrix},
  author        = {Leeuw, Jan de and Graffelman, Jan},
  year          = {2024},
  eprint        = {2211.13150},
  archivePrefix = {arXiv},
  primaryClass  = {stat.CO},
  doi           = {10.1080/00031305.2023.2186952},
}
APA 7
Leeuw, J., & Graffelman, J. (2024). Improved approximation and visualization of the correlation matrix. arXiv. https://doi.org/10.1080/00031305.2023.2186952
MLA 9
Leeuw, Jan de, and Jan Graffelman. "Improved approximation and visualization of the correlation matrix." arXiv, 2024, doi.org/10.1080/00031305.2023.2186952.

Key Terms

principal (0.281)
correlation (0.277)
squares (0.273)
alternating (0.264)
matrix (0.256)
weighted (0.217)
component (0.190)
representation (0.182)

Citation Network

Current paper (gray), citations (green), references (blue)

Display is limited for performance on very large graphs.

Current Paper
Citations
References
Click to view
Title Authors Year Actions

Comments (0)

This website uses cookies to ensure you get the best experience. Learn more