On the visualisation of the correlation matrix
Publication
Metrics
AI Quick Summary
This paper presents improved algorithms and visualization techniques for approximating correlation matrices, addressing the challenges of visualizing adjusted matrices. It employs a weighted alternating least squares algorithm with scalar or column-only adjustments to balance numerical accuracy and clarity in correlation biplots.
Paper Preview
Abstract
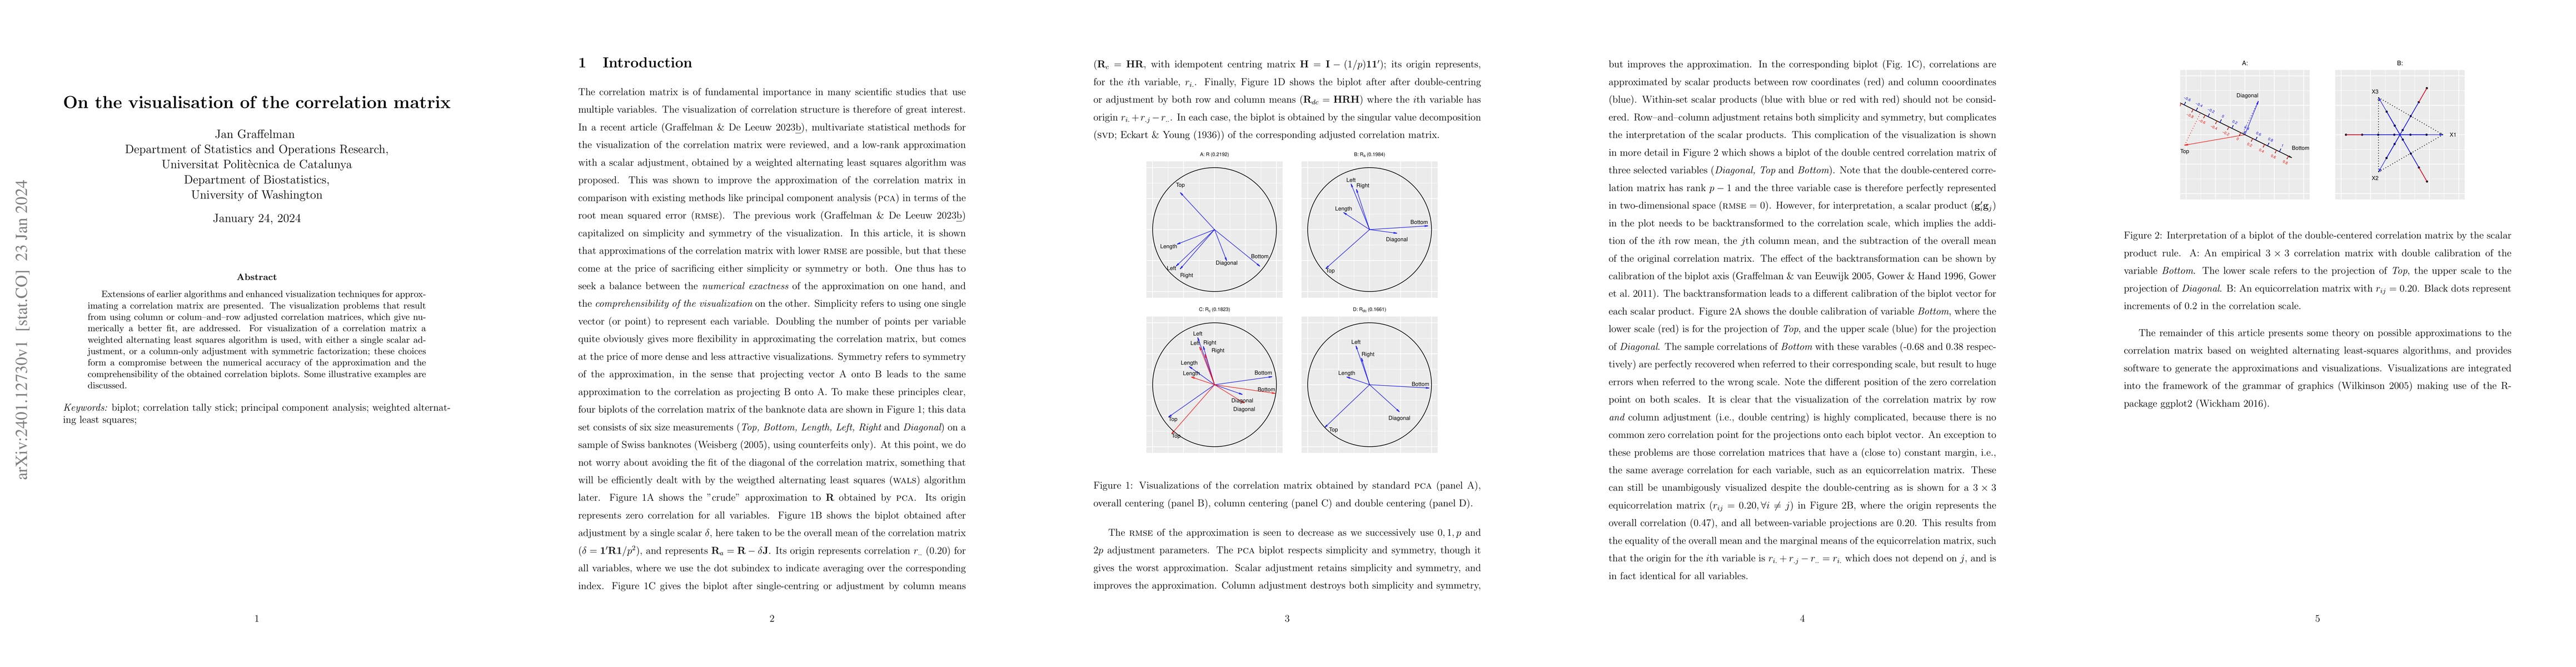
Extensions of earlier algorithms and enhanced visualization techniques for approximating a correlation matrix are presented. The visualization problems that result from using column or colum--and--row adjusted correlation matrices, which give numerically a better fit, are addressed. For visualization of a correlation matrix a weighted alternating least squares algorithm is used, with either a single scalar adjustment, or a column-only adjustment with symmetric factorization; these choices form a compromise between the numerical accuracy of the approximation and the comprehensibility of the obtained correlation biplots. Some illustrative examples are discussed.
AI Key Findings
Get AI-generated insights about this paper's methodology, results, significance, and more — seven facets brought into focus.
Impact
Paper Details
Authors
PDF Preview
Key Terms
Citation Network
Current paper (gray), citations (green), references (blue)
Display is limited for performance on very large graphs.
Discussion 0