ArxivLens

Publication

Published: Mar 03, 2026
Categories: cs.HC

Metrics

Source: ArXiv

Quick Answers

What methodology did the authors use?

We conducted a formative study with five low‑vision participants to identify essential chart context elements, then a within‑subject comparative study with 22 participants comparing baseline, a focus+context overlay (Dynamic Context), and a mini‑map approach. More in Methodology →

What are the key results?

Dynamic Context significantly improved perceived usability (SUS 76 vs 52 baseline) and reduced effort and physical demand. — Mini‑map enhanced spatial orientation but was less preferred and did not improve accuracy or completion time. More in Key Results →

Why is this work significant?

The study demonstrates that pointer‑based visual context can make complex charts more accessible for low‑vision users while preserving existing assistive technology workflows, informing future design of inclusive visualizations. More in Significance →

What are the main limitations?

Learning effects from repeated chart exposure may have reduced differences across conditions. — Heterogeneous assistive‑technology usage and small sample size limit generalizability. More in Limitations →

Paper Preview

Abstract

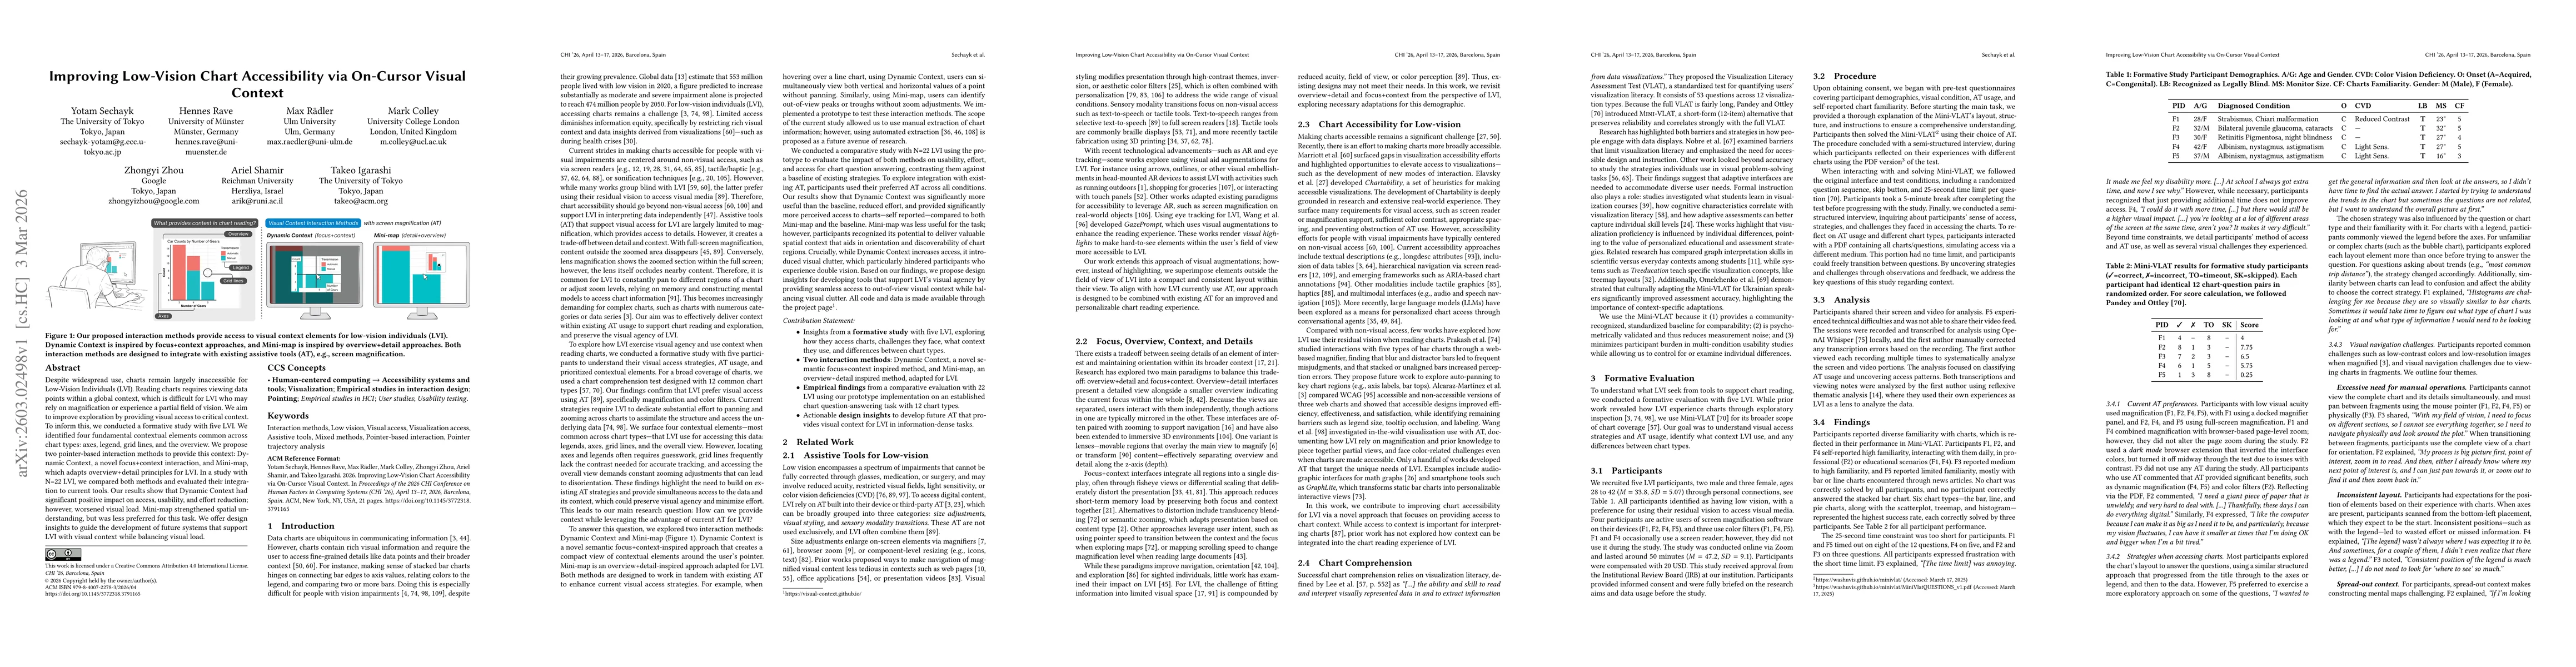
Despite widespread use, charts remain largely inaccessible for Low-Vision Individuals (LVI). Reading charts requires viewing data points within a global context, which is difficult for LVI who may rely on magnification or experience a partial field of vision. We aim to improve exploration by providing visual access to critical context. To inform this, we conducted a formative study with five LVI. We identified four fundamental contextual elements common across chart types: axes, legend, grid lines, and the overview. We propose two pointer-based interaction methods to provide this context: Dynamic Context, a novel focus+context interaction, and Mini-map, which adapts overview+detail principles for LVI. In a study with N=22 LVI, we compared both methods and evaluated their integration to current tools. Our results show that Dynamic Context had significant positive impact on access, usability, and effort reduction; however, worsened visual load. Mini-map strengthened spatial understanding, but was less preferred for this task. We offer design insights to guide the development of future systems that support LVI with visual context while balancing visual load.

Key Findings, in focus

Seven facets of this paper, analysed and brought into focus by AI.

AI-generated · verify against source Generated Mar 04, 2026
In focus · one-line synthesis

The study demonstrates that pointer‑based visual context can make complex charts more accessible for low‑vision users while preserving existing assistive technology workflows, informing future design of inclusive visualizations.

01
MethodologyHow they did it

We conducted a formative study with five low‑vision participants to identify essential chart context elements, then a within‑subject comparative study with 22 participants comparing baseline, a focus+context overlay (Dynamic Context), and a mini‑map approach.

02
ResultsWhat they found
  • Dynamic Context significantly improved perceived usability (SUS 76 vs 52 baseline) and reduced effort and physical demand.
  • Mini‑map enhanced spatial orientation but was less preferred and did not improve accuracy or completion time.
  • Both methods did not change accuracy or completion time, but Dynamic Context increased visual load.
03
SignificanceWhy it matters

The study demonstrates that pointer‑based visual context can make complex charts more accessible for low‑vision users while preserving existing assistive technology workflows, informing future design of inclusive visualizations.

04
Technical ContributionsWhat's new technically

A compact, pointer‑centered focus+context overlay (Dynamic Context) and a mini‑map adaptation that integrate seamlessly with existing assistive technologies for low‑vision chart reading.

05
NoveltyWhat sets it apart

First empirical evaluation of visual context overlays tailored for low‑vision chart users, combining focus+context with an on‑cursor mini‑map and demonstrating measurable usability gains.

06
LimitationsWhat to be cautious about
  • Learning effects from repeated chart exposure may have reduced differences across conditions.
  • Heterogeneous assistive‑technology usage and small sample size limit generalizability.
07
Future WorkWhere it goes next
  • Longitudinal evaluation to assess sustained use and performance gains.
  • Automatic adaptation of context overlays to users’ current AT settings and visual conditions.

Paper Details

Paper ID: 2603.02498
Comments: CHI '26, Barcelona, Spain
Categories:
cs.HC

How to Cite This Paper

Reference manager: RIS EndNote


Discussion 0

This website uses cookies to ensure you get the best experience. Learn more