Hennes Rave
5 papers on arXiv
Academic Profile
Statistics
Similar Authors
Papers on arXiv
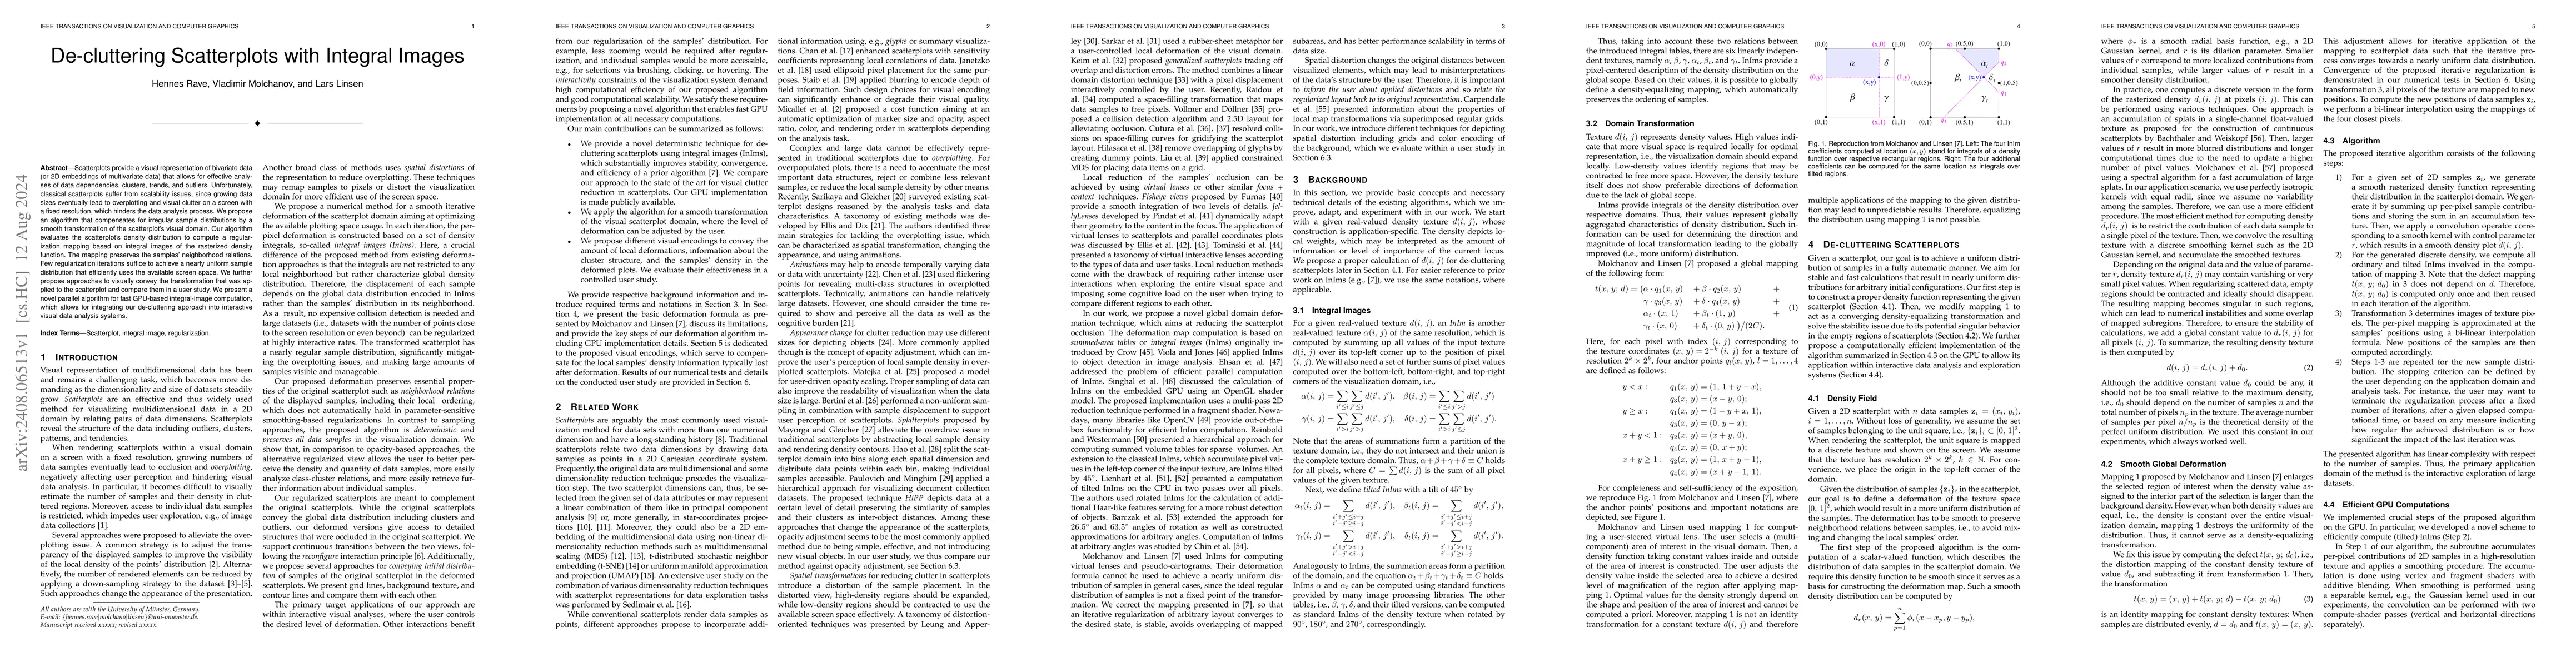
De-cluttering Scatterplots with Integral Images
Scatterplots provide a visual representation of bivariate data (or 2D embeddings of multivariate data) that allows for effective analyses of data dependencies, clusters, trends, and outliers. Unfortun...
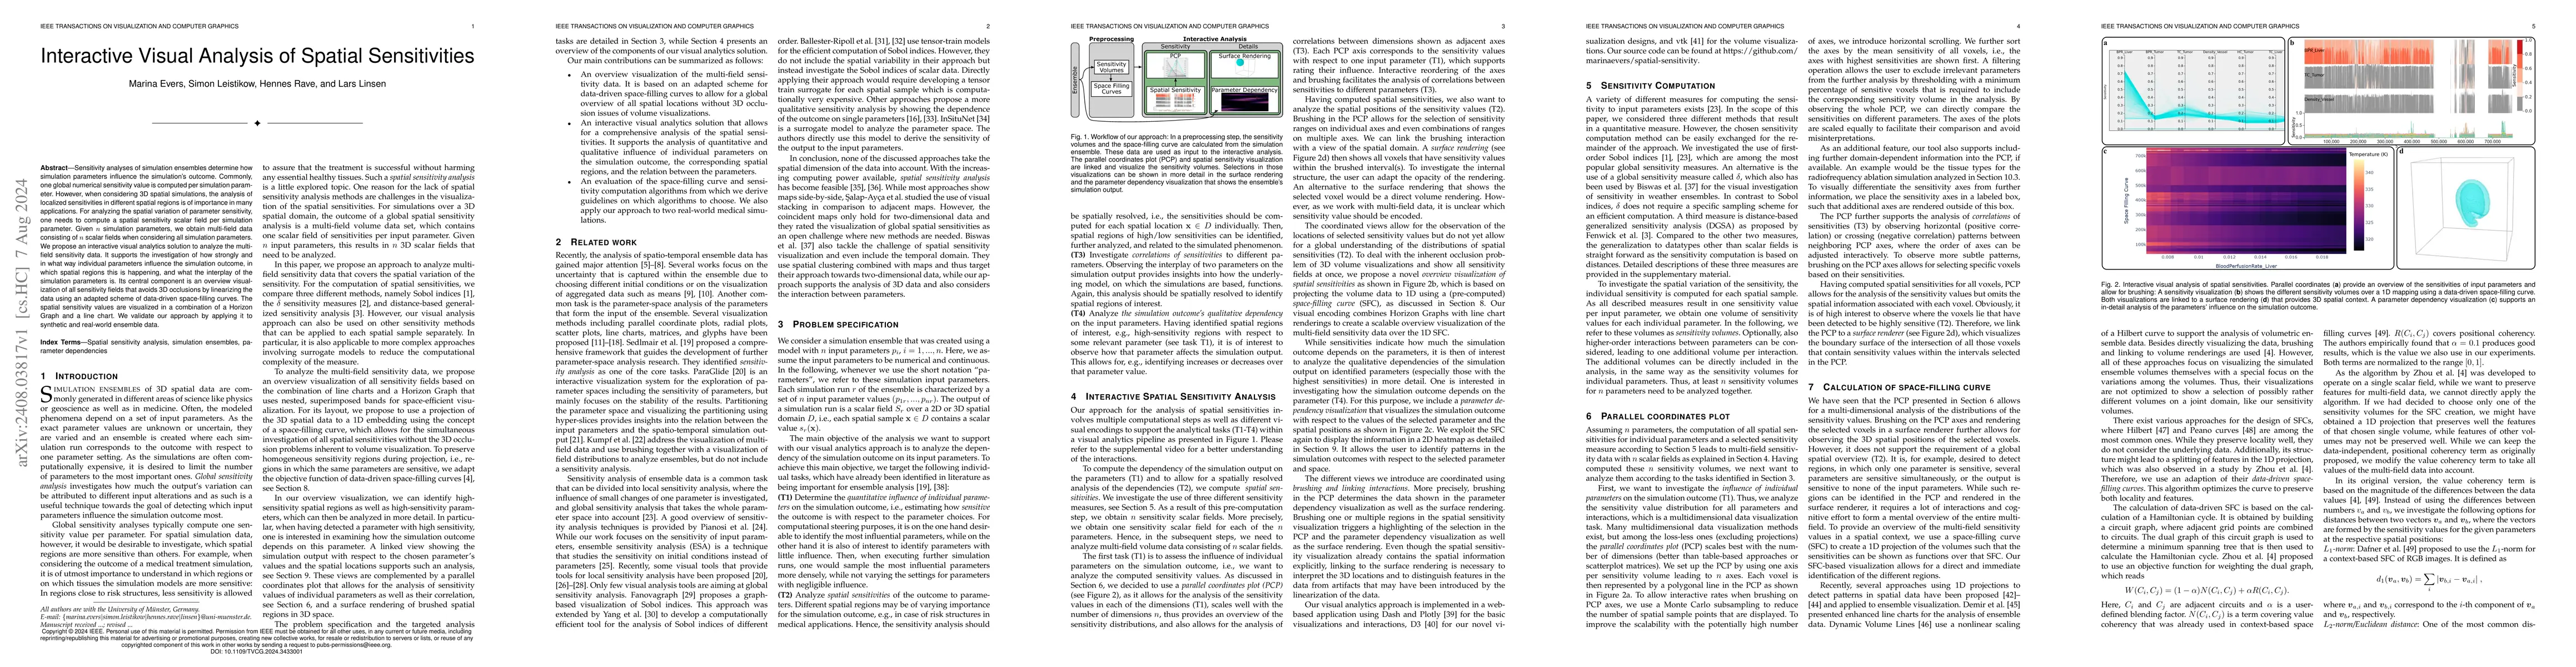
Interactive Visual Analysis of Spatial Sensitivities
Sensitivity analyses of simulation ensembles determine how simulation parameters influence the simulation's outcome. Commonly, one global numerical sensitivity value is computed per simulation paramet...
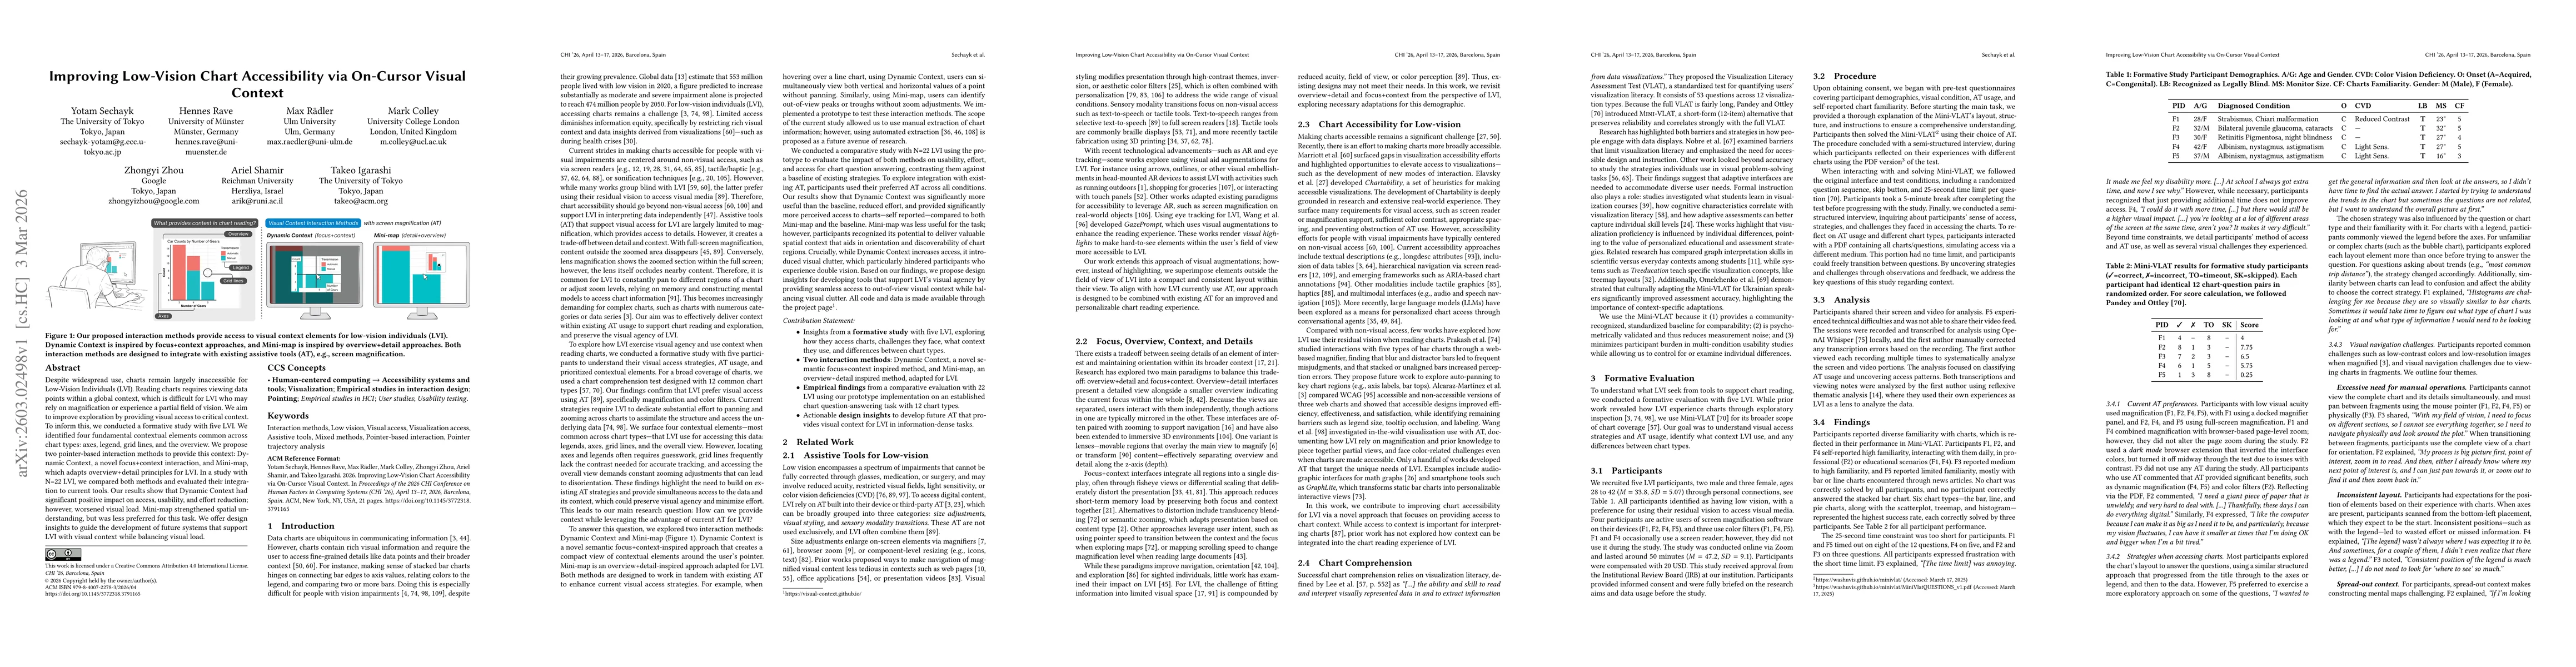
Improving Low-Vision Chart Accessibility via On-Cursor Visual Context
Despite widespread use, charts remain largely inaccessible for Low-Vision Individuals (LVI). Reading charts requires viewing data points within a global context, which is difficult for LVI who may rel...
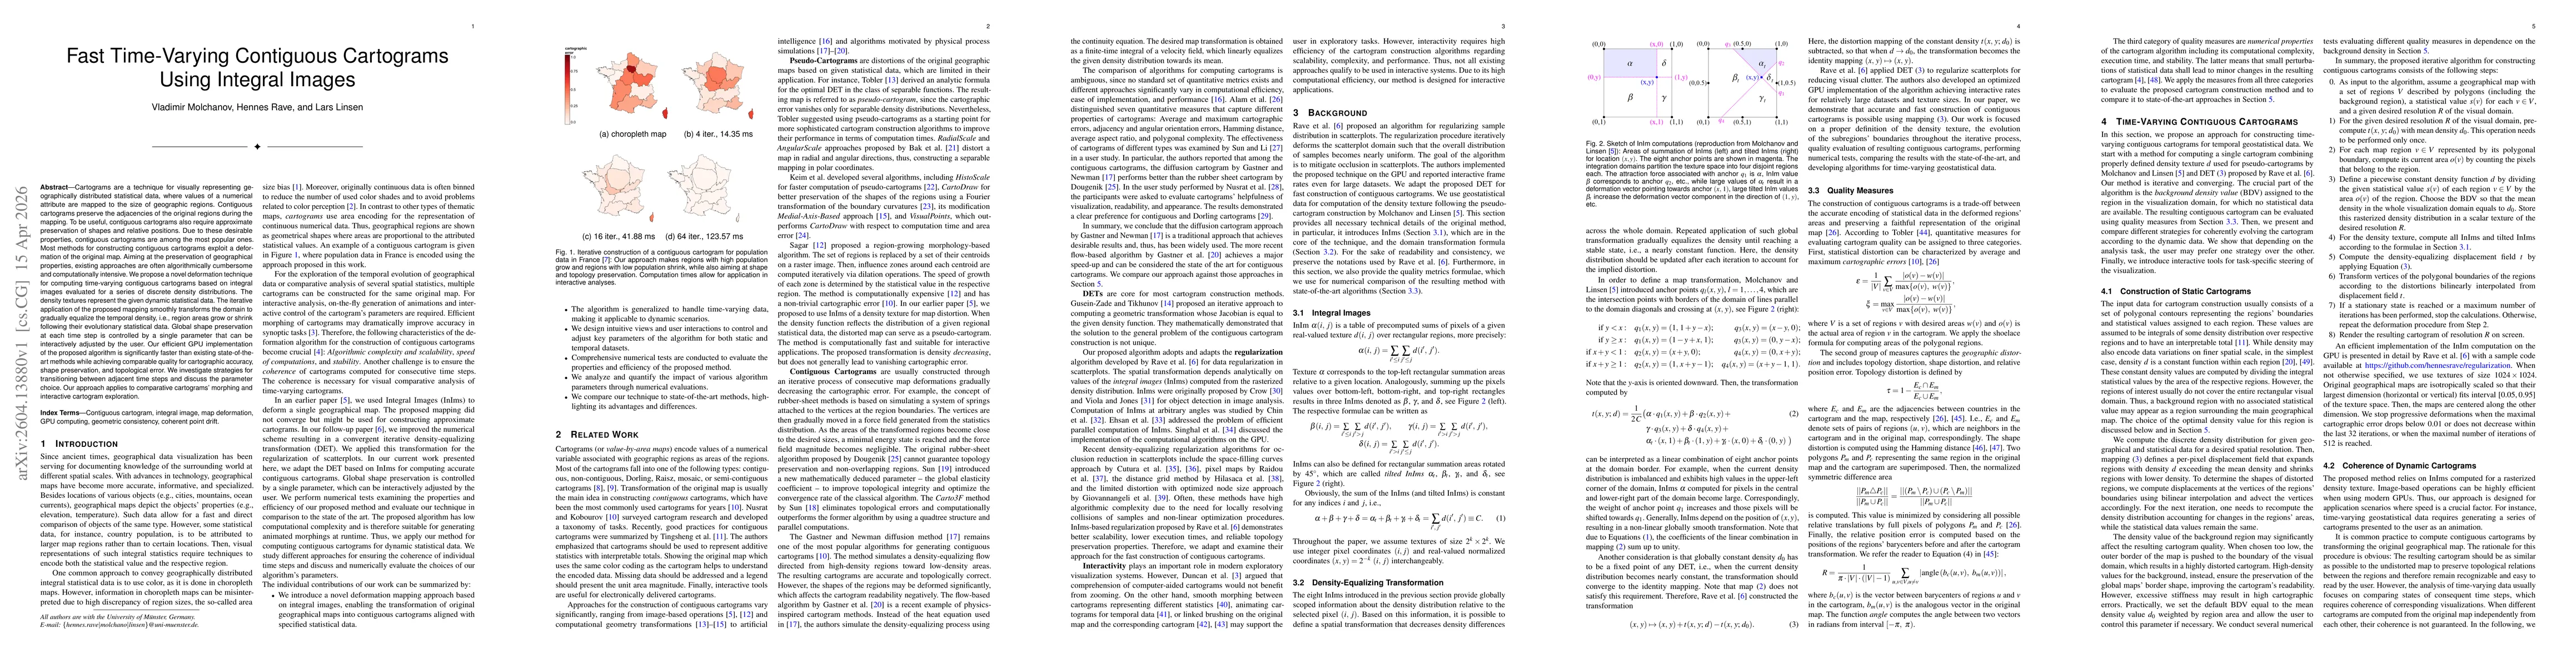
Fast Time-Varying Contiguous Cartograms Using Integral Images
Cartograms are a technique for visually representing geographically distributed statistical data, where values of a numerical attribute are mapped to the size of geographic regions. Contiguous cartogr...
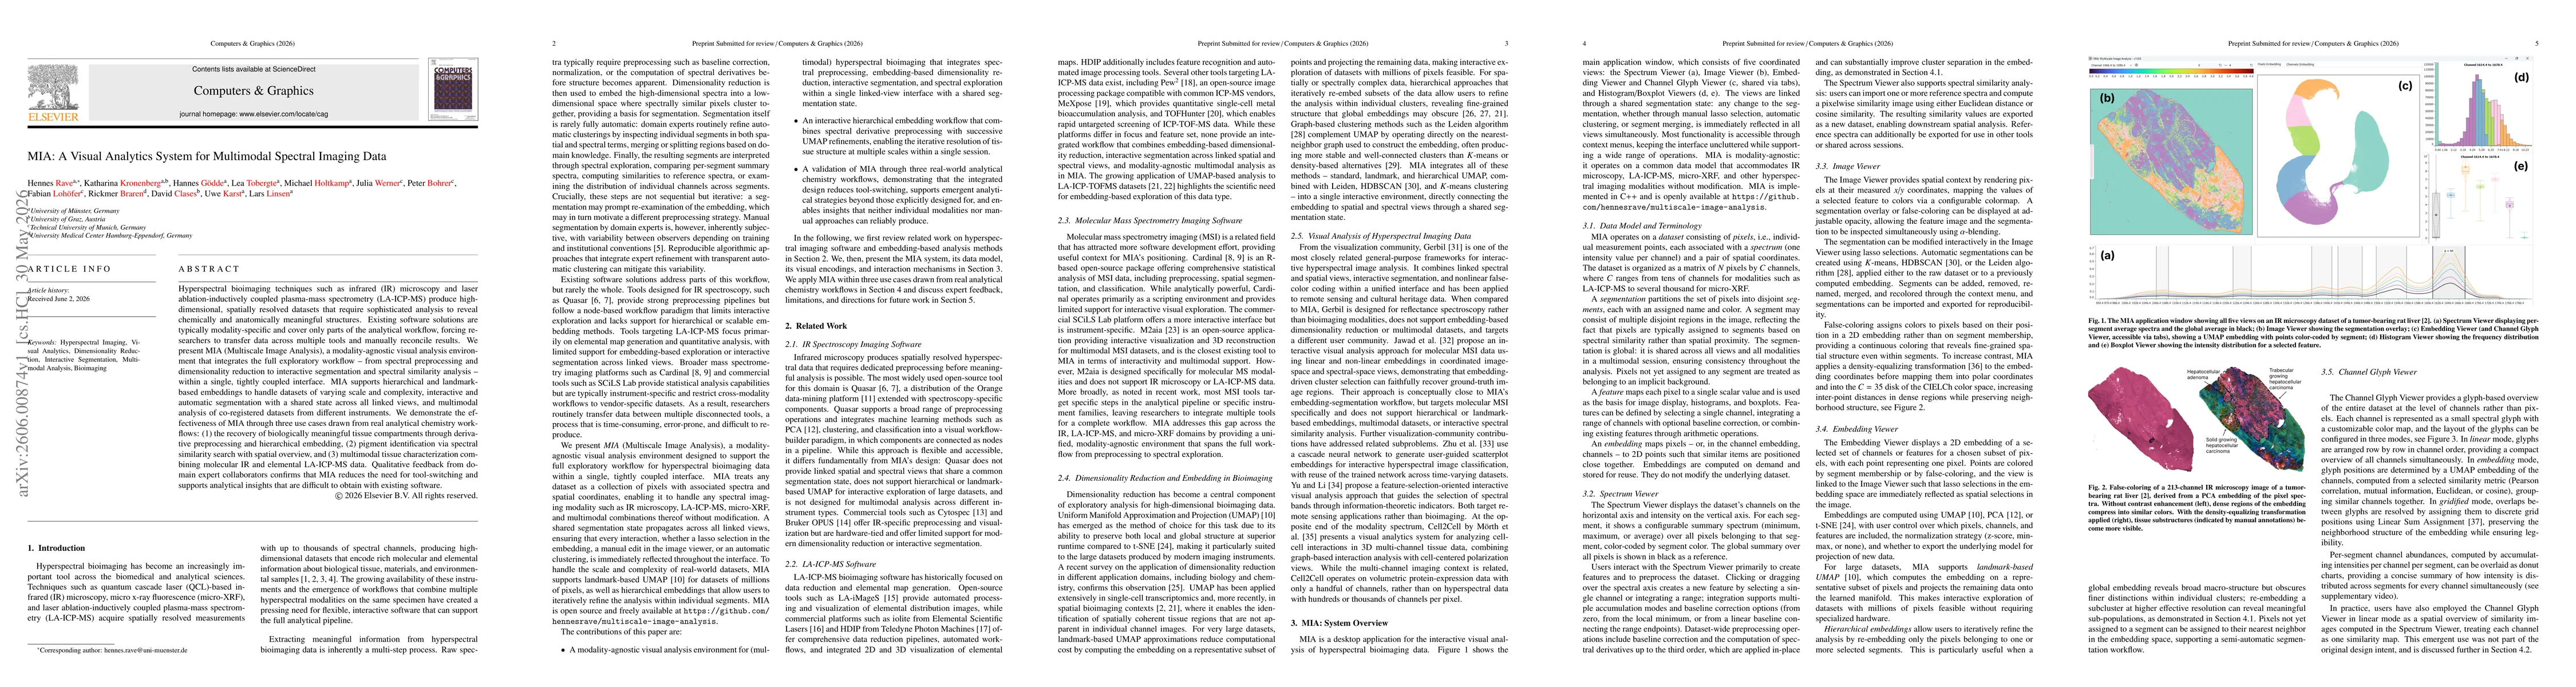
MIA: A Visual Analytics System for Multimodal Spectral Imaging Data
Hyperspectral bioimaging techniques such as infrared (IR) microscopy and laser ablation-inductively coupled plasma-mass spectrometry (LA-ICP-MS) produce high-dimensional, spatially resolved datasets t...