Publication
Metrics
AI Quick Summary
This paper proposes an algorithm to de-clutter scatterplots by transforming the visual domain based on density distributions computed via integral images, thereby preserving neighborhood relations and achieving a nearly uniform sample distribution. The method is implemented in a fast parallel GPU algorithm for interactive data analysis.
Paper Preview
Abstract
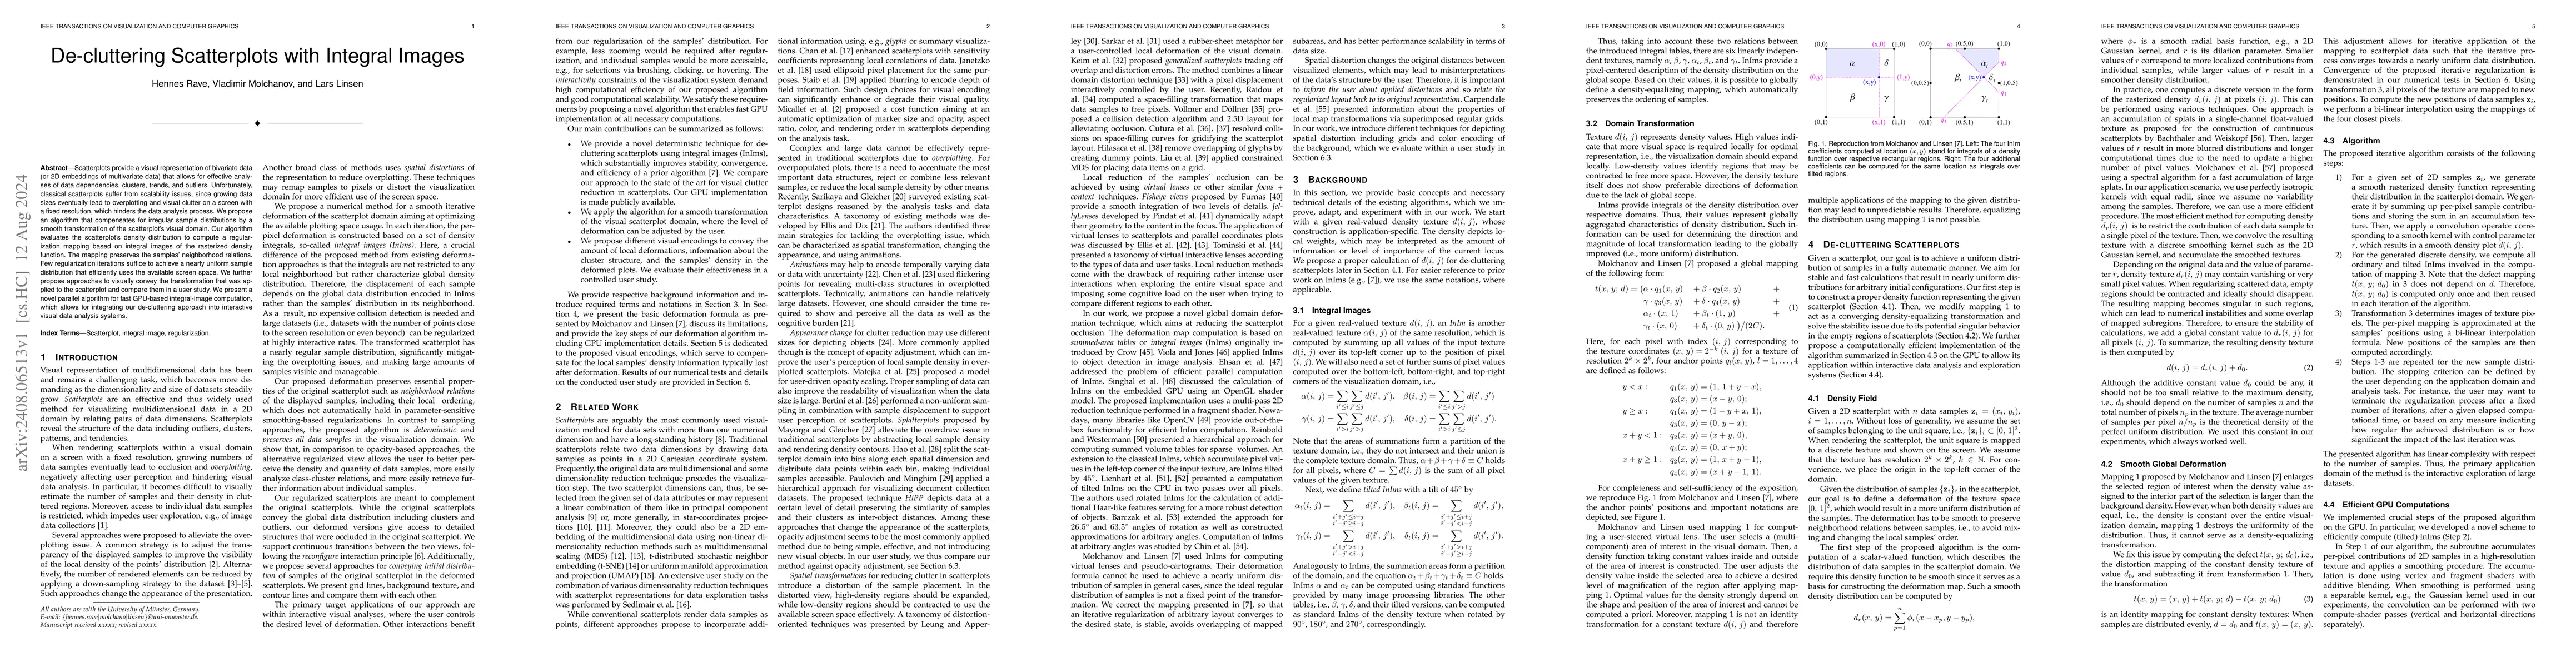
Scatterplots provide a visual representation of bivariate data (or 2D embeddings of multivariate data) that allows for effective analyses of data dependencies, clusters, trends, and outliers. Unfortunately, classical scatterplots suffer from scalability issues, since growing data sizes eventually lead to overplotting and visual clutter on a screen with a fixed resolution, which hinders the data analysis process. We propose an algorithm that compensates for irregular sample distributions by a smooth transformation of the scatterplot's visual domain. Our algorithm evaluates the scatterplot's density distribution to compute a regularization mapping based on integral images of the rasterized density function. The mapping preserves the samples' neighborhood relations. Few regularization iterations suffice to achieve a nearly uniform sample distribution that efficiently uses the available screen space. We further propose approaches to visually convey the transformation that was applied to the scatterplot and compare them in a user study. We present a novel parallel algorithm for fast GPU-based integral-image computation, which allows for integrating our de-cluttering approach into interactive visual data analysis systems.
AI Key Findings
Get AI-generated insights about this paper's methodology, results, significance, and more — seven facets brought into focus.
Impact
Paper Details
Authors
PDF Preview
Citation Network
Current paper (gray), citations (green), references (blue)
Display is limited for performance on very large graphs.
Discussion 0