Academic Profile
Statistics
Similar Authors
Papers on arXiv
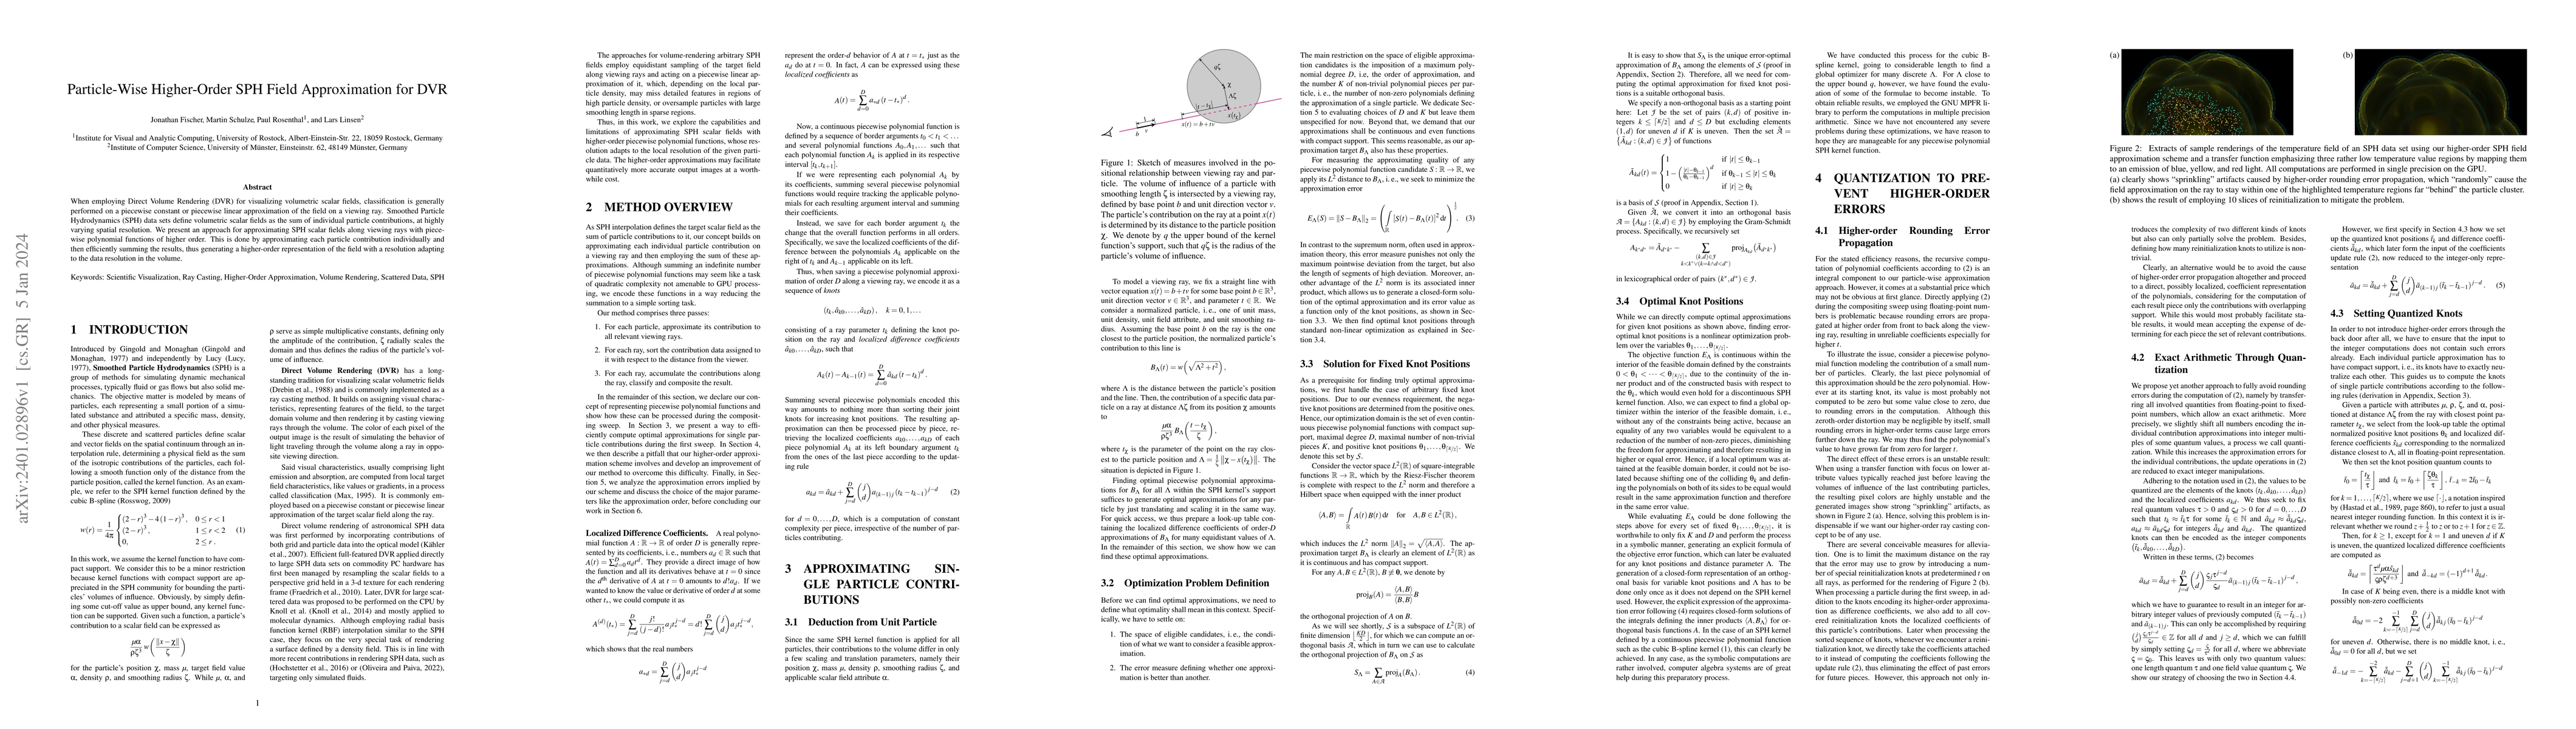
When employing Direct Volume Rendering (DVR) for visualizing volumetric scalar fields, classification is generally performed on a piecewise constant or piecewise linear approximation of the field on...
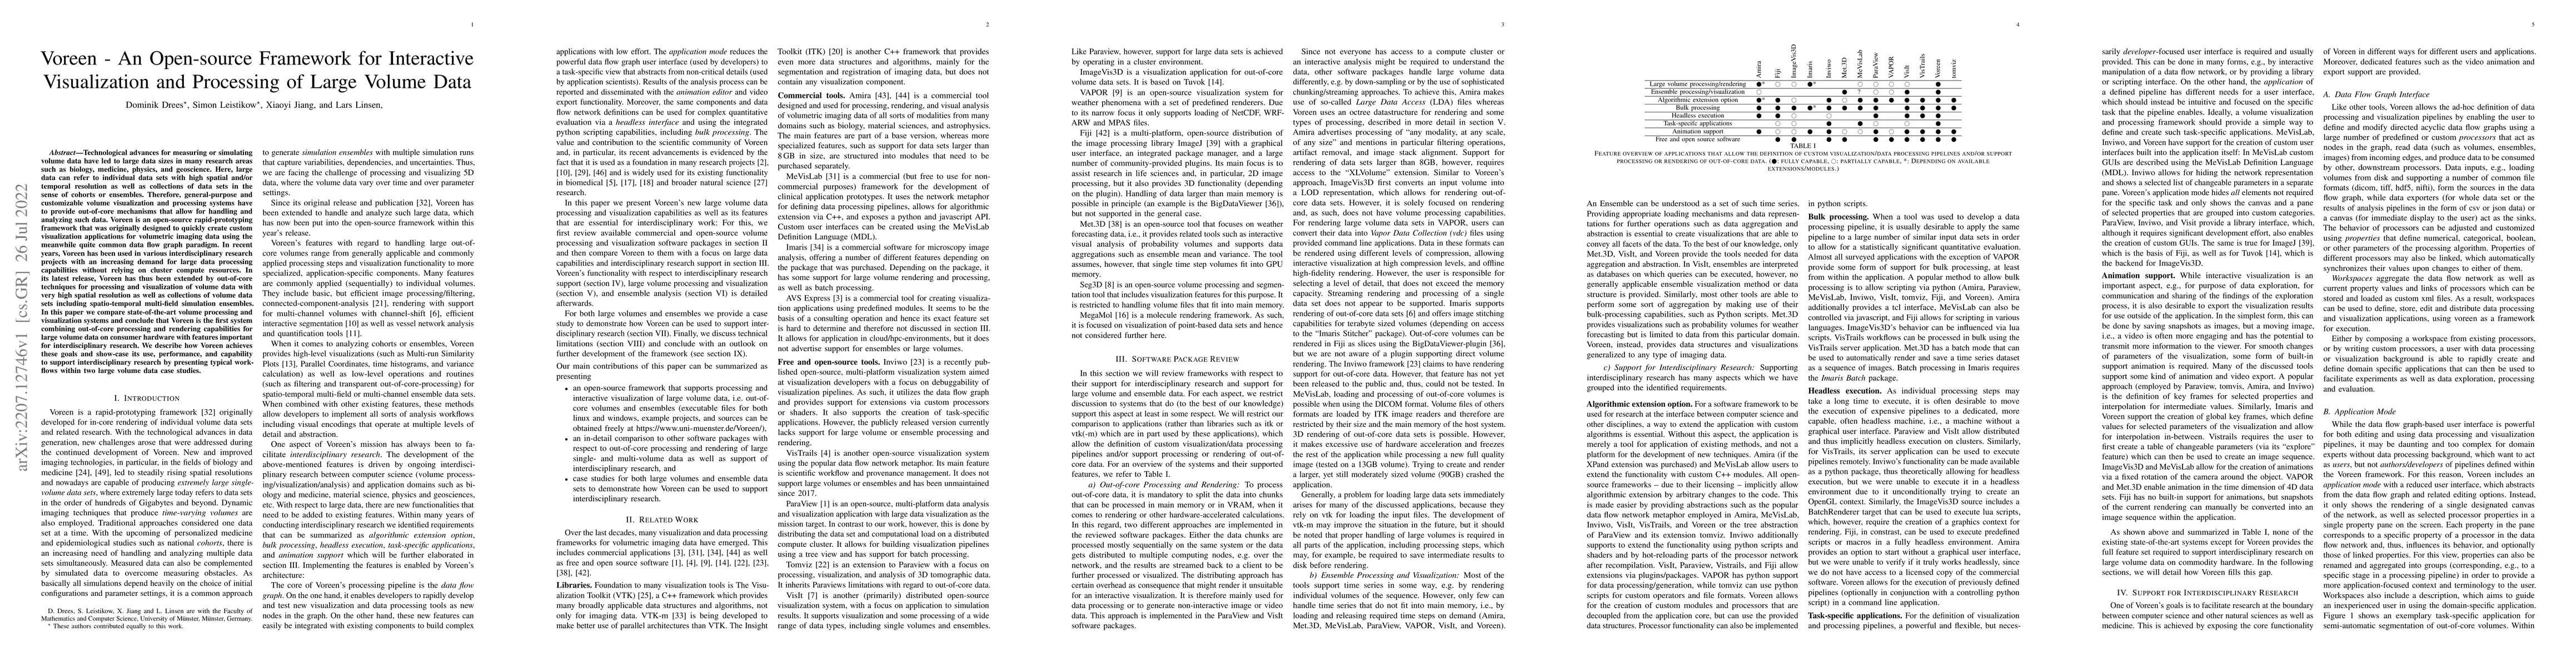
Technological advances for measuring or simulating volume data have led to large data sizes in many research areas such as biology, medicine, physics, and geoscience. Here, large data can refer to i...
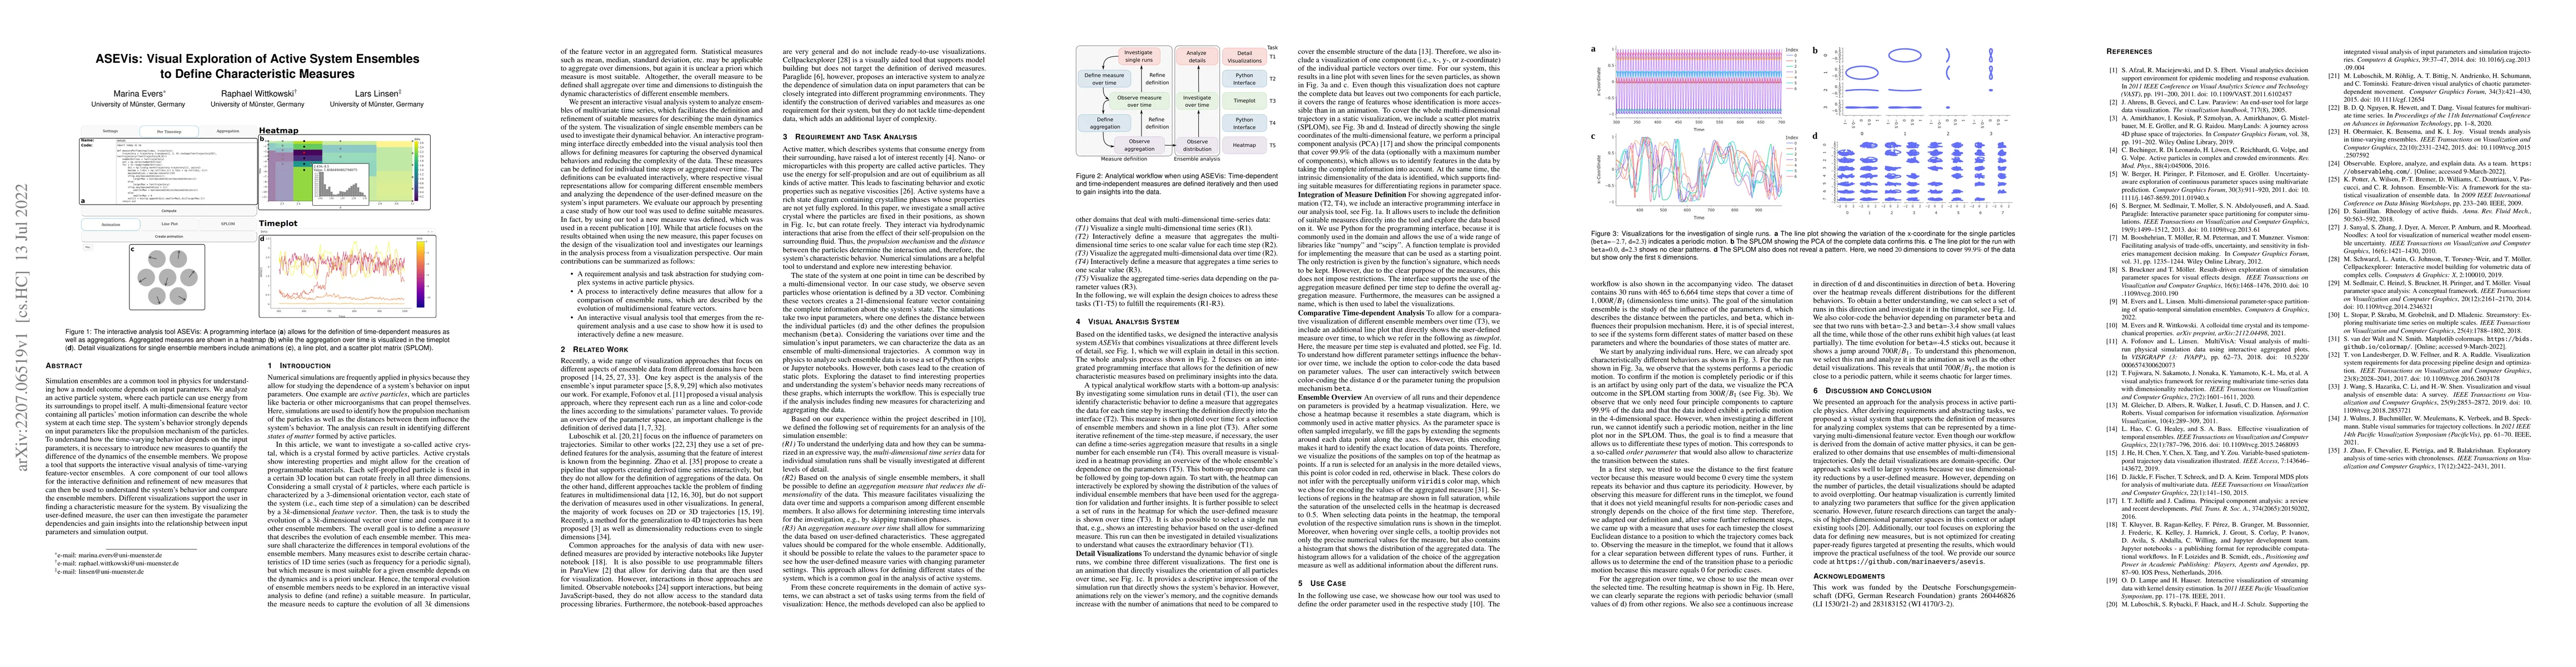
Simulation ensembles are a common tool in physics for understanding how a model outcome depends on input parameters. We analyze an active particle system, where each particle can use energy from its...
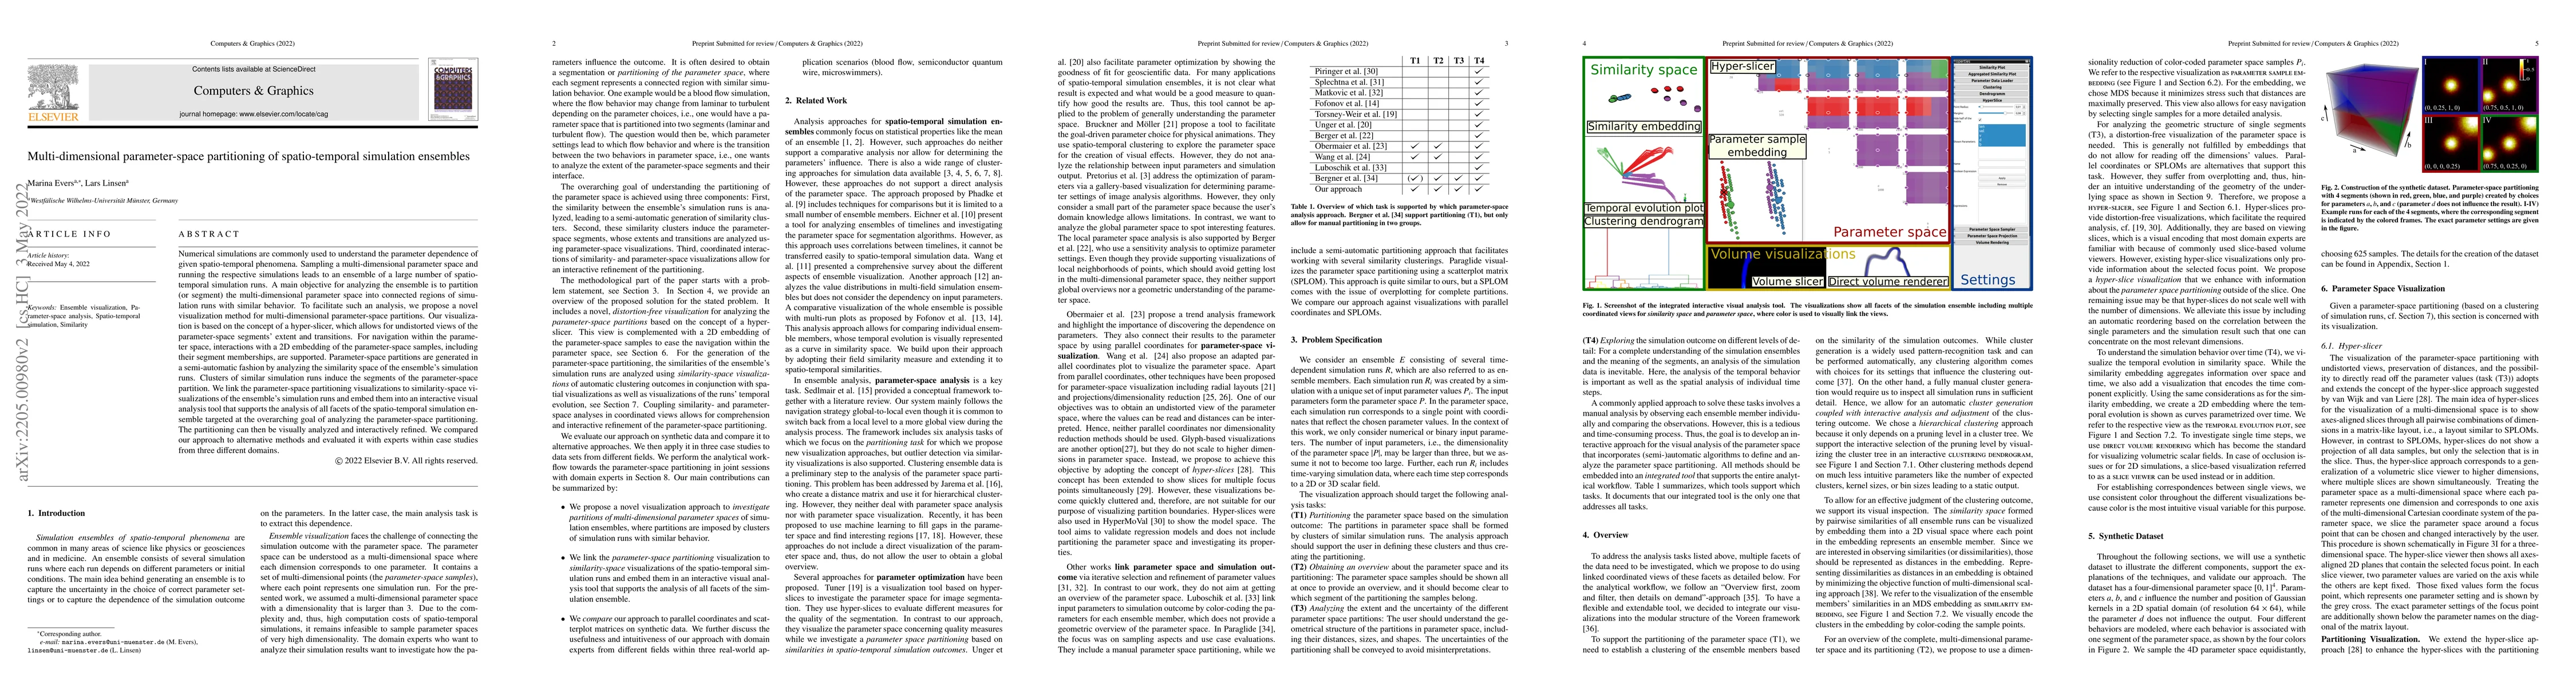
Numerical simulations are commonly used to understand the parameter dependence of given spatio-temporal phenomena. Sampling a multi-dimensional parameter space and running the respective simulations...
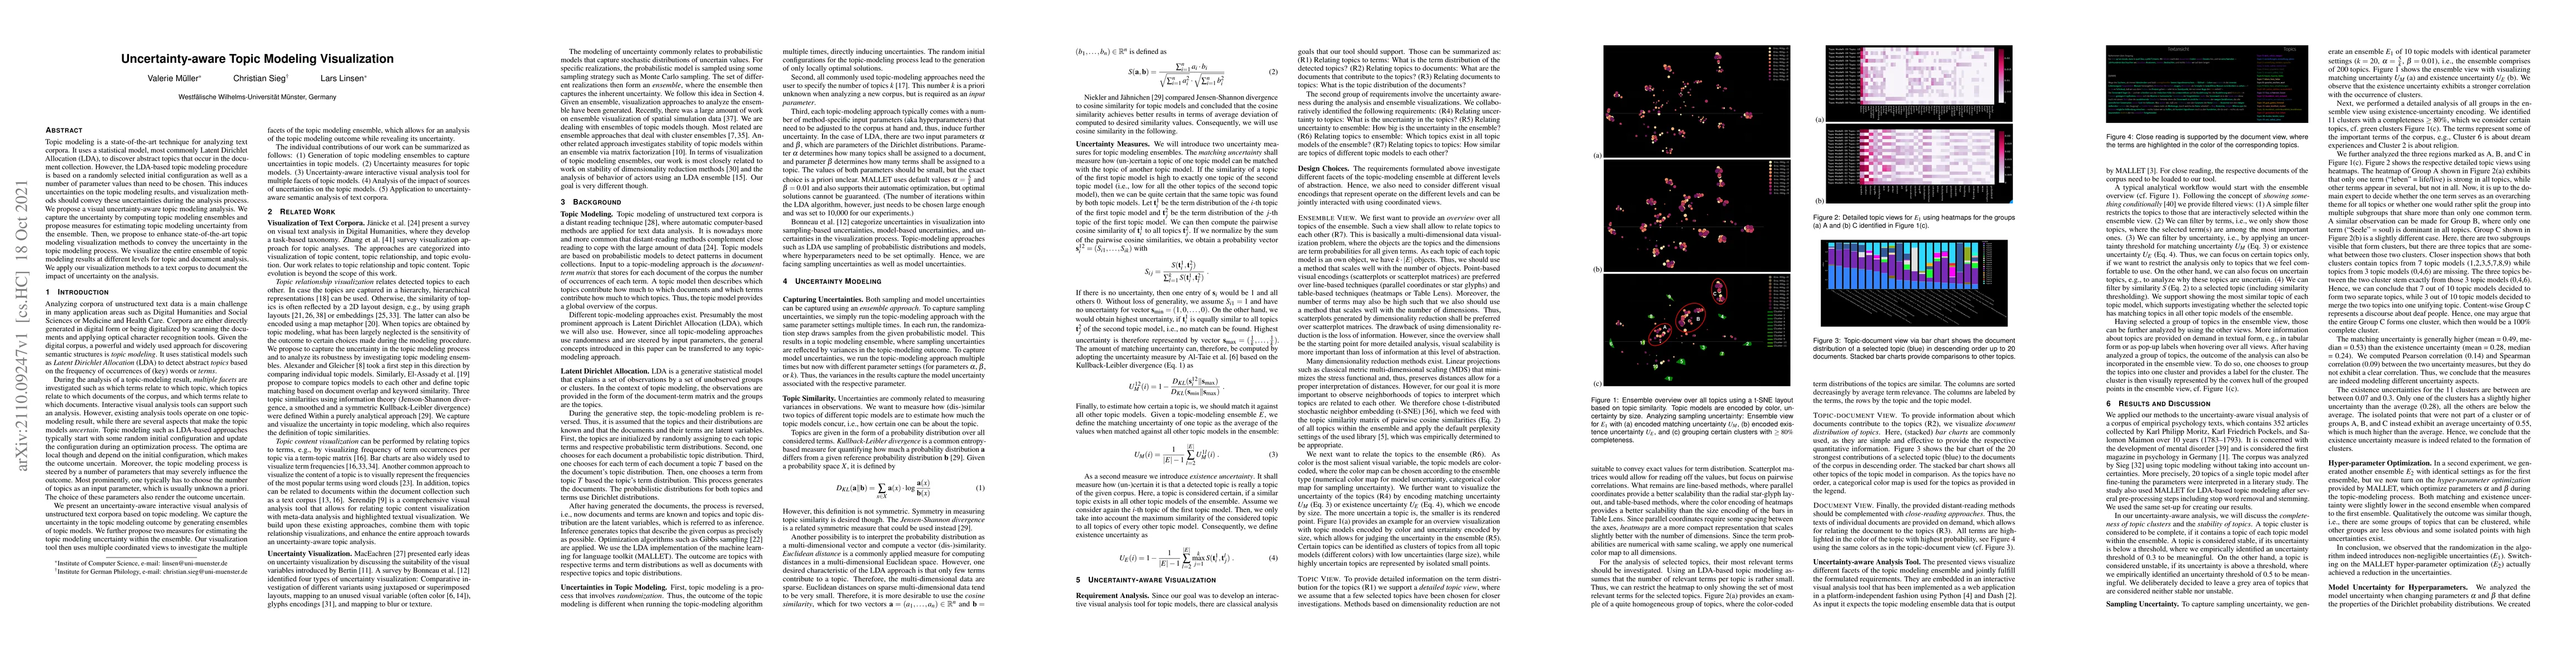
Topic modeling is a state-of-the-art technique for analyzing text corpora. It uses a statistical model, most commonly Latent Dirichlet Allocation (LDA), to discover abstract topics that occur in the...
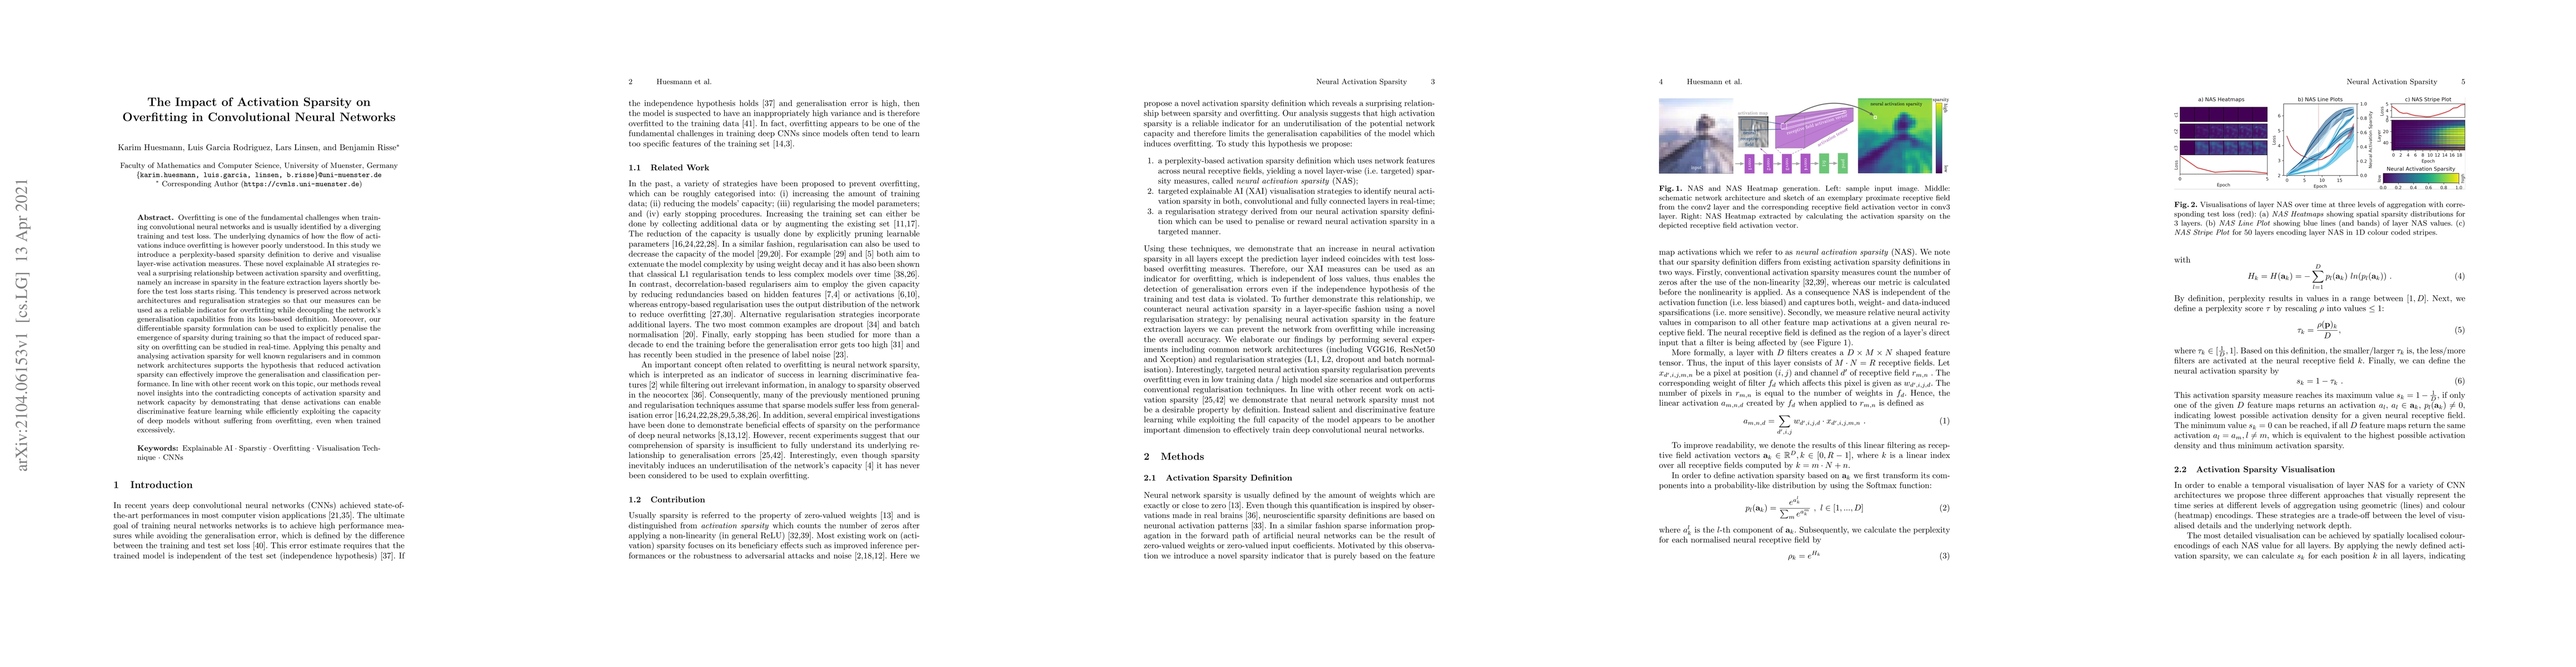
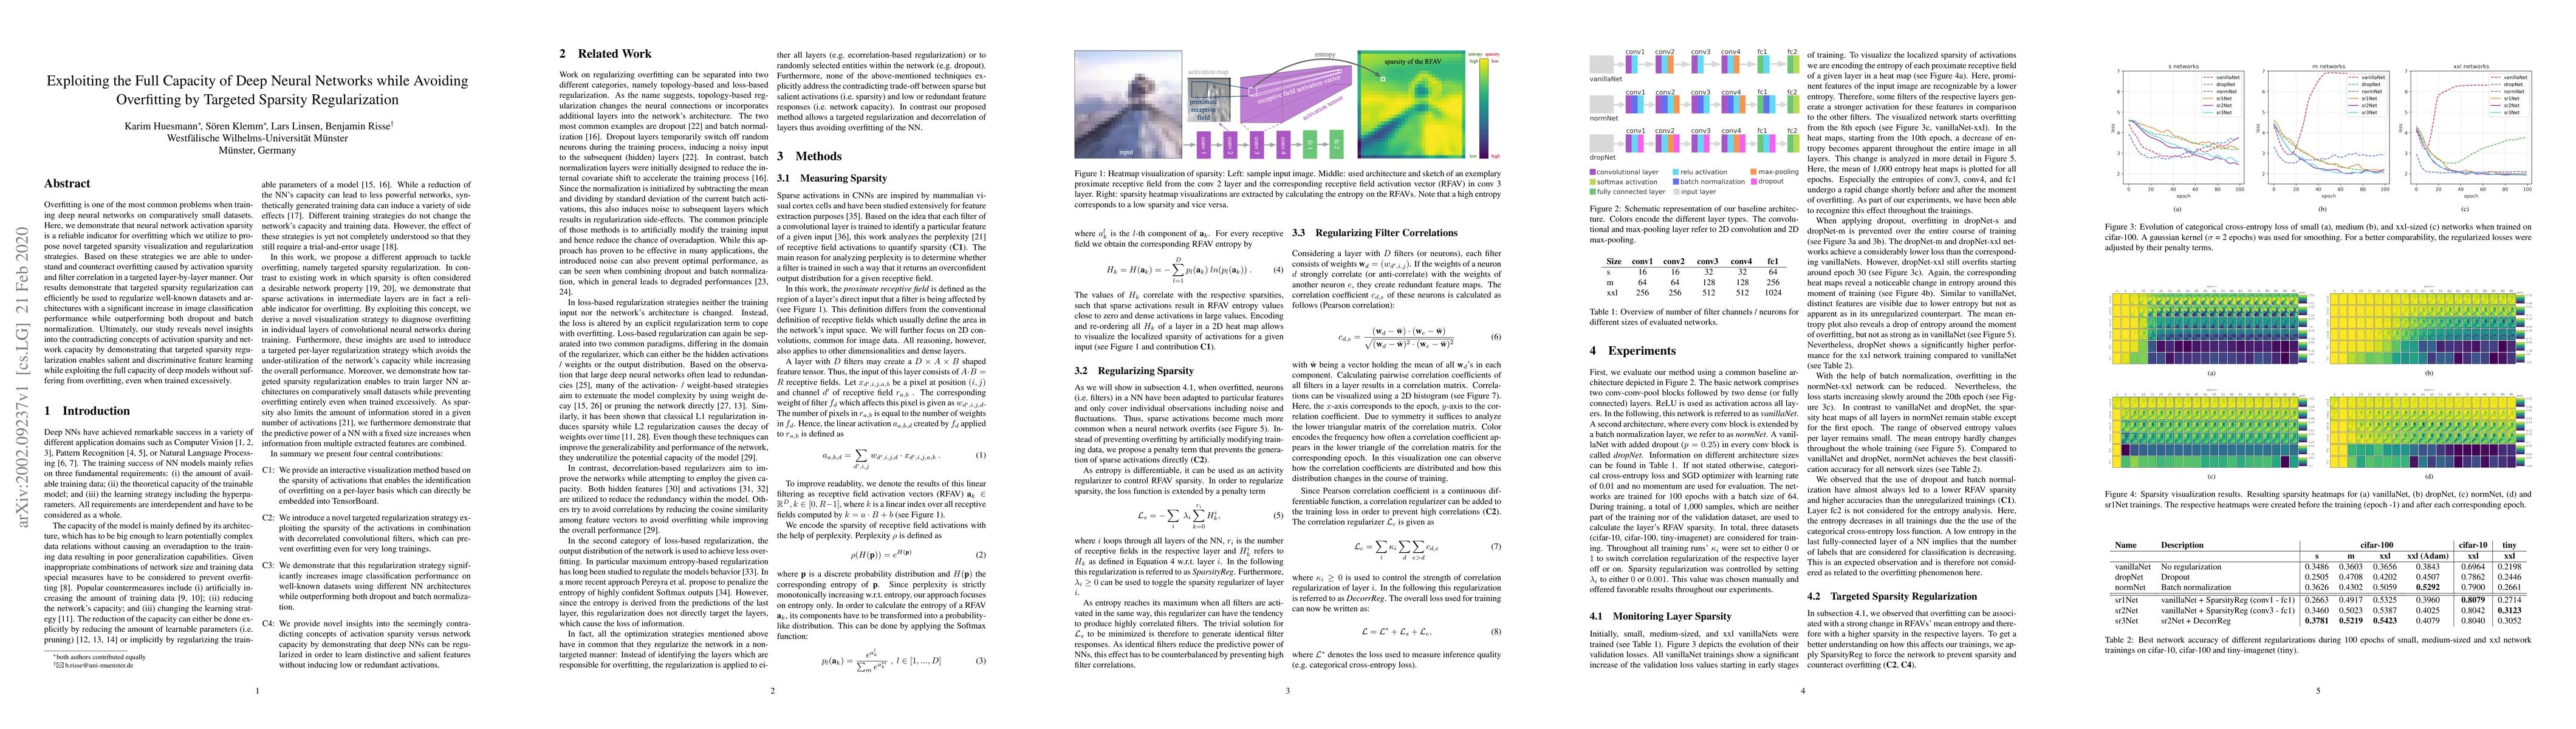
Overfitting is one of the fundamental challenges when training convolutional neural networks and is usually identified by a diverging training and test loss. The underlying dynamics of how the flow ...
Overfitting is one of the most common problems when training deep neural networks on comparatively small datasets. Here, we demonstrate that neural network activation sparsity is a reliable indicato...
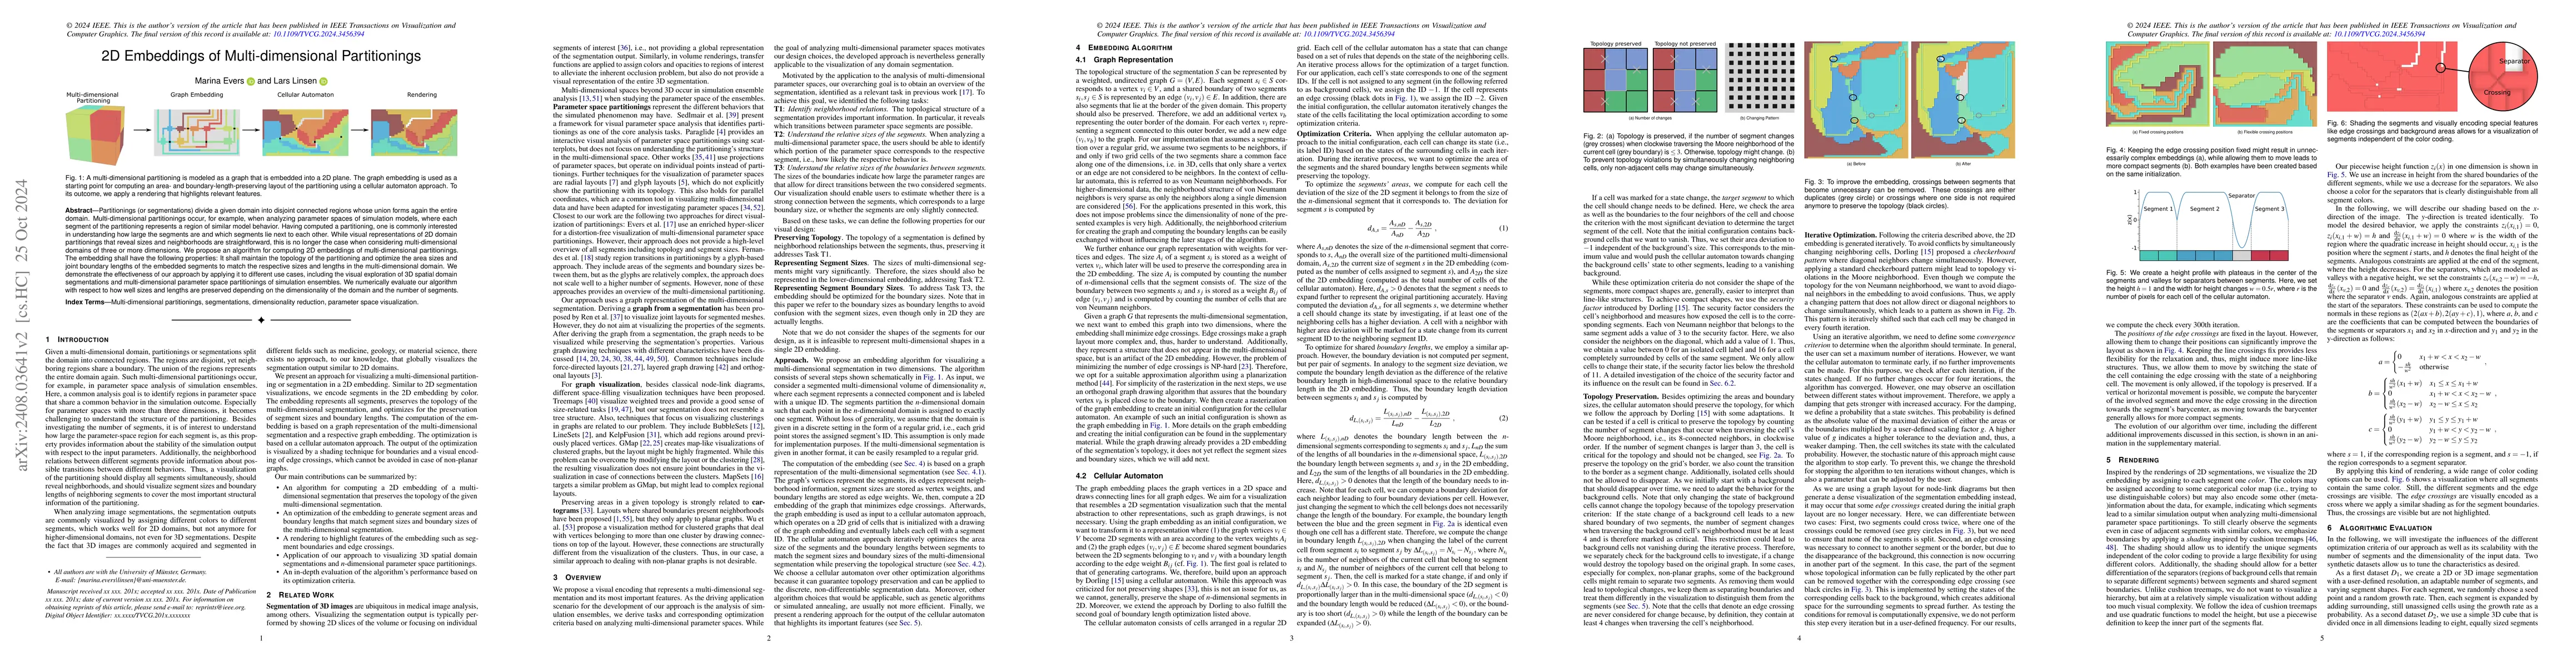
Partitionings (or segmentations) divide a given domain into disjoint connected regions whose union forms again the entire domain. Multi-dimensional partitionings occur, for example, when analyzing par...
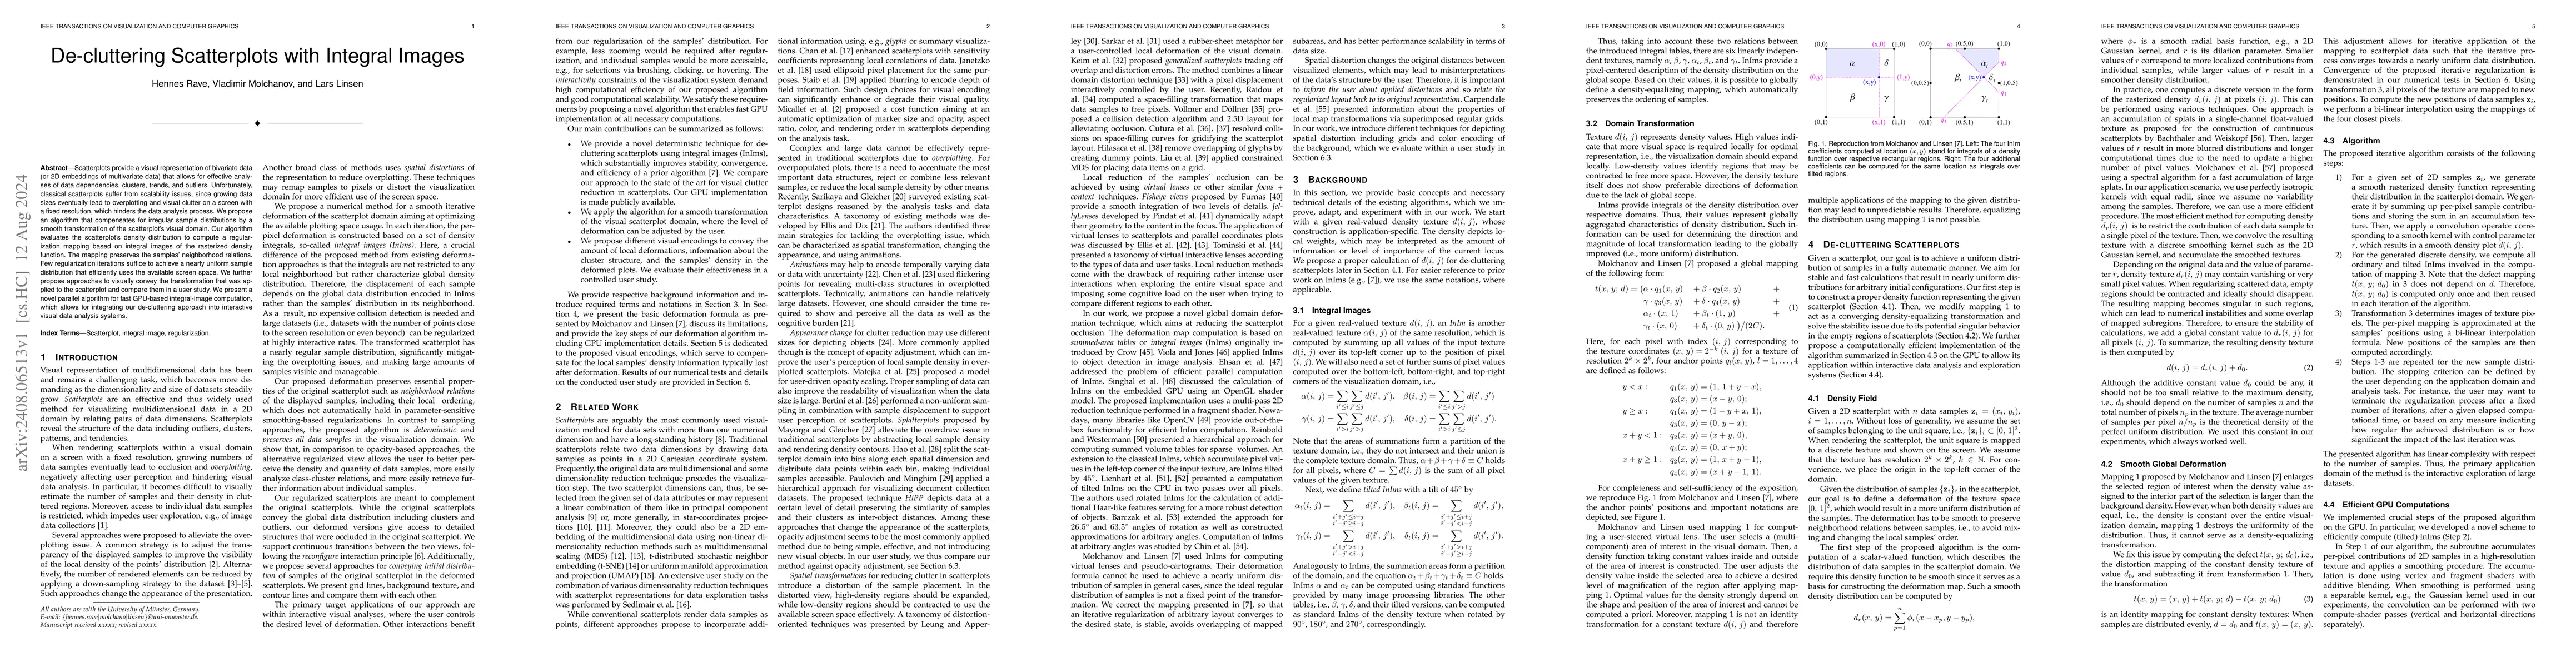
Scatterplots provide a visual representation of bivariate data (or 2D embeddings of multivariate data) that allows for effective analyses of data dependencies, clusters, trends, and outliers. Unfortun...
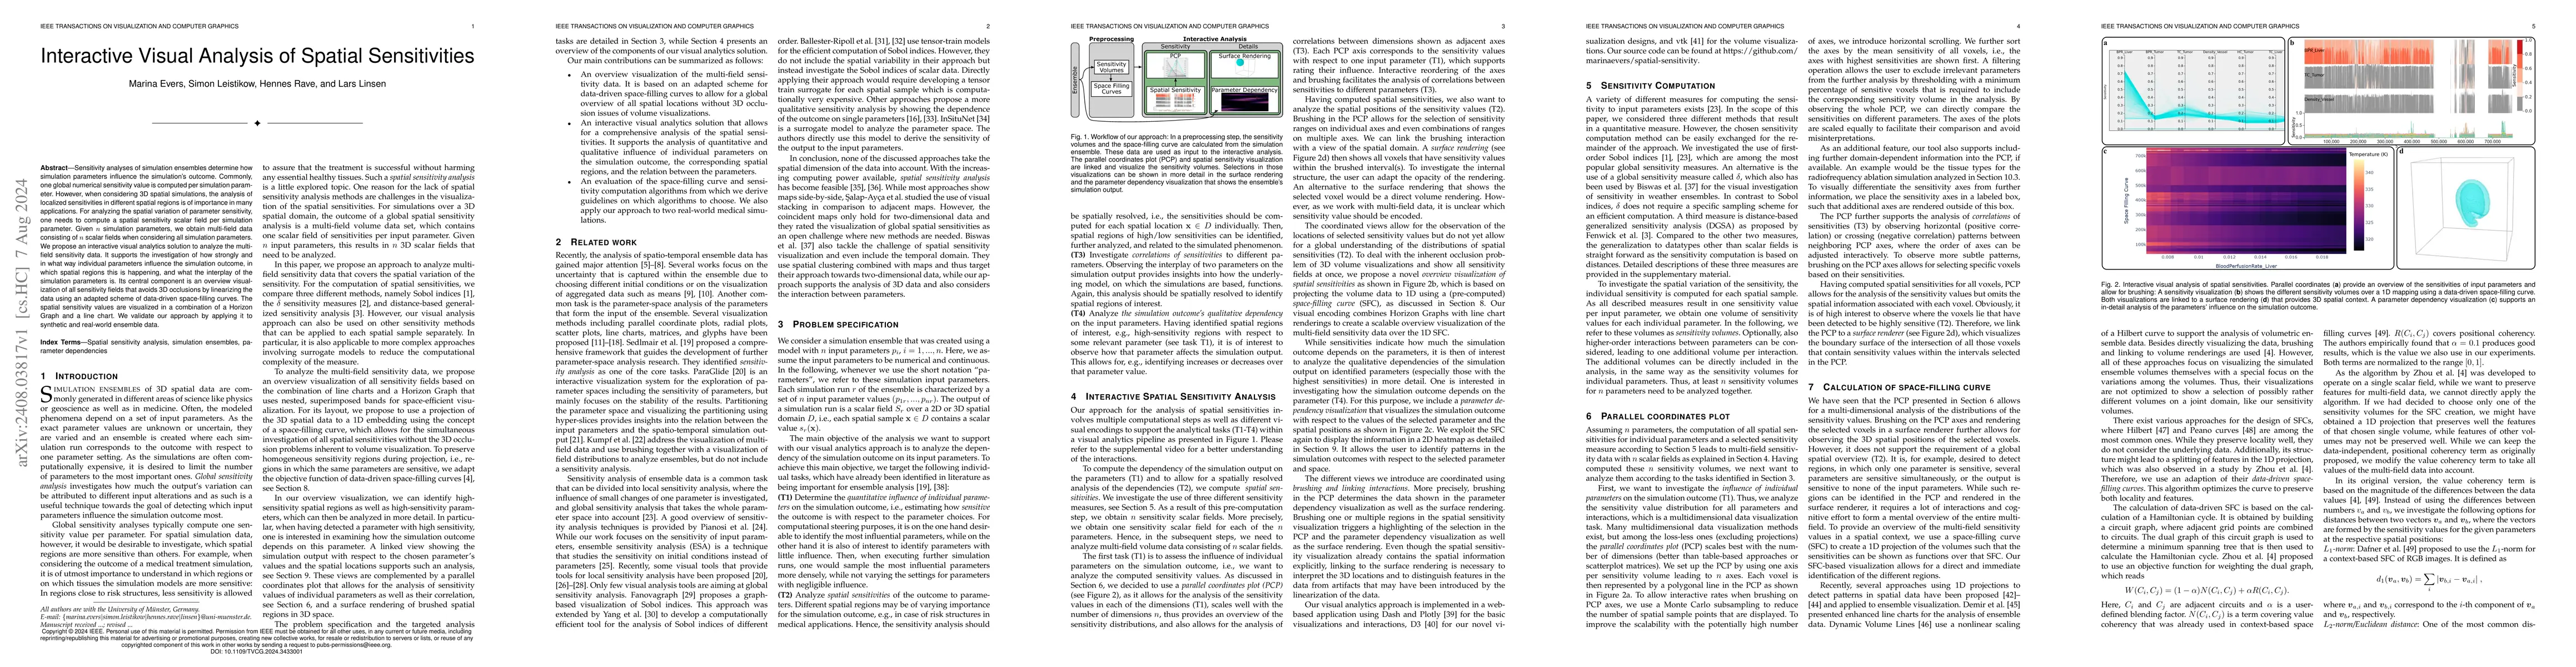
Sensitivity analyses of simulation ensembles determine how simulation parameters influence the simulation's outcome. Commonly, one global numerical sensitivity value is computed per simulation paramet...
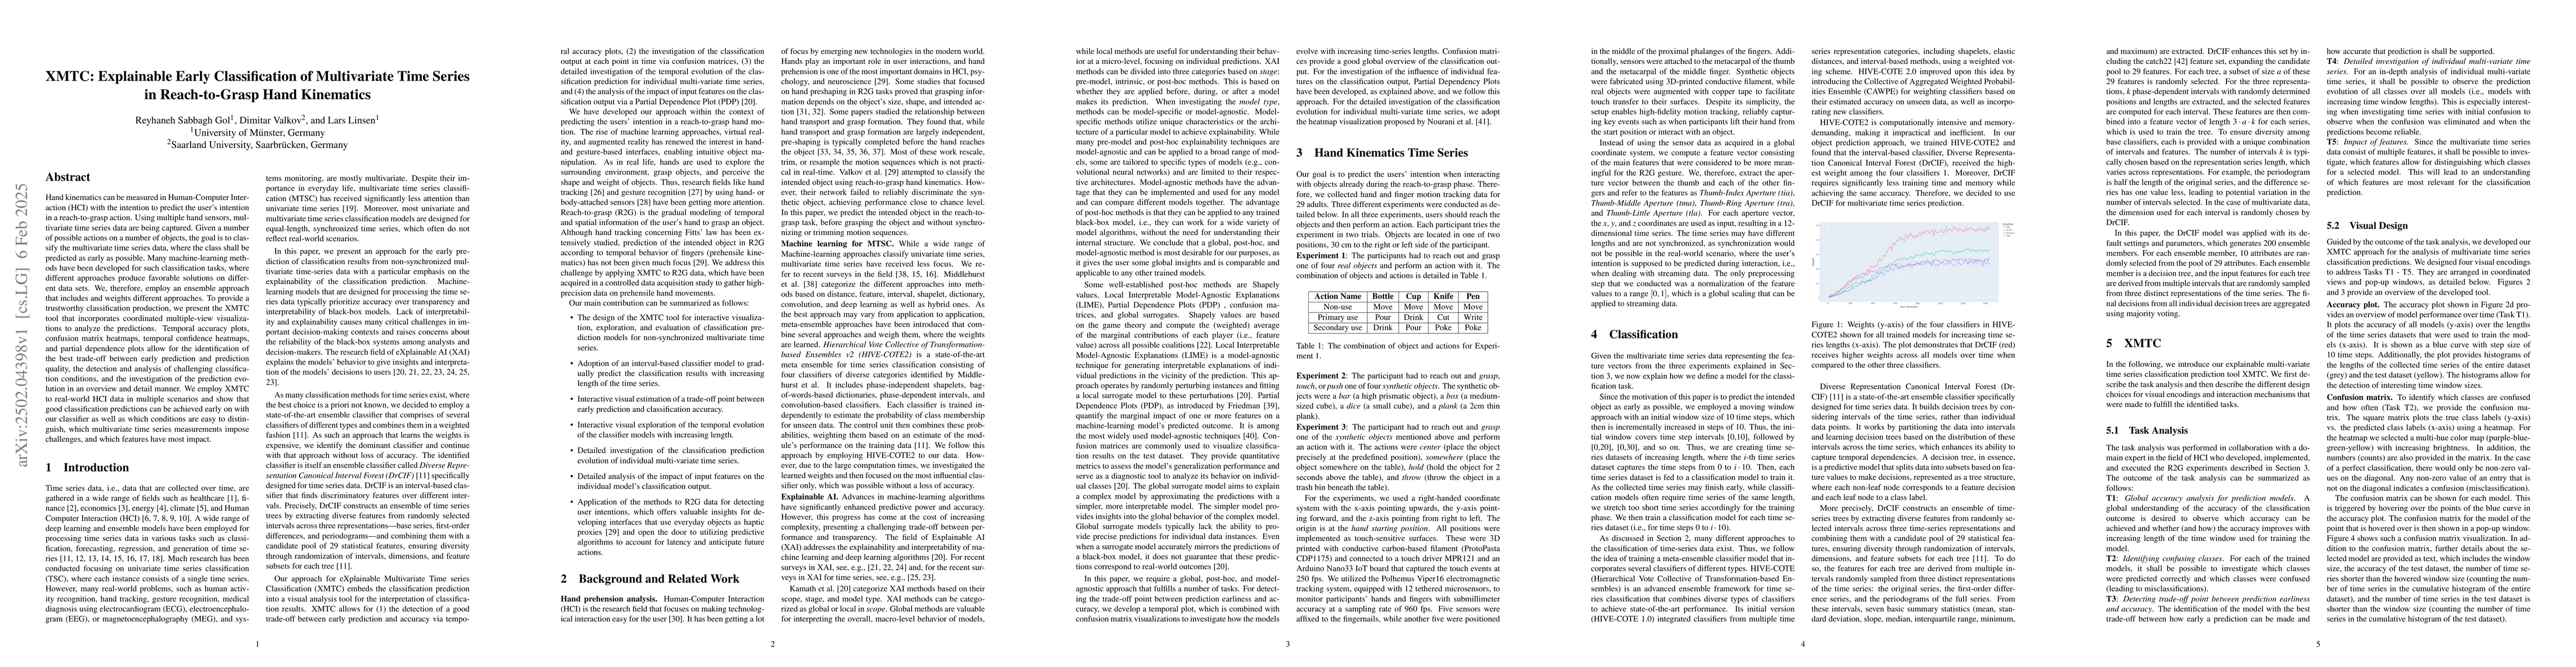
Hand kinematics can be measured in Human-Computer Interaction (HCI) with the intention to predict the user's intention in a reach-to-grasp action. Using multiple hand sensors, multivariate time series...
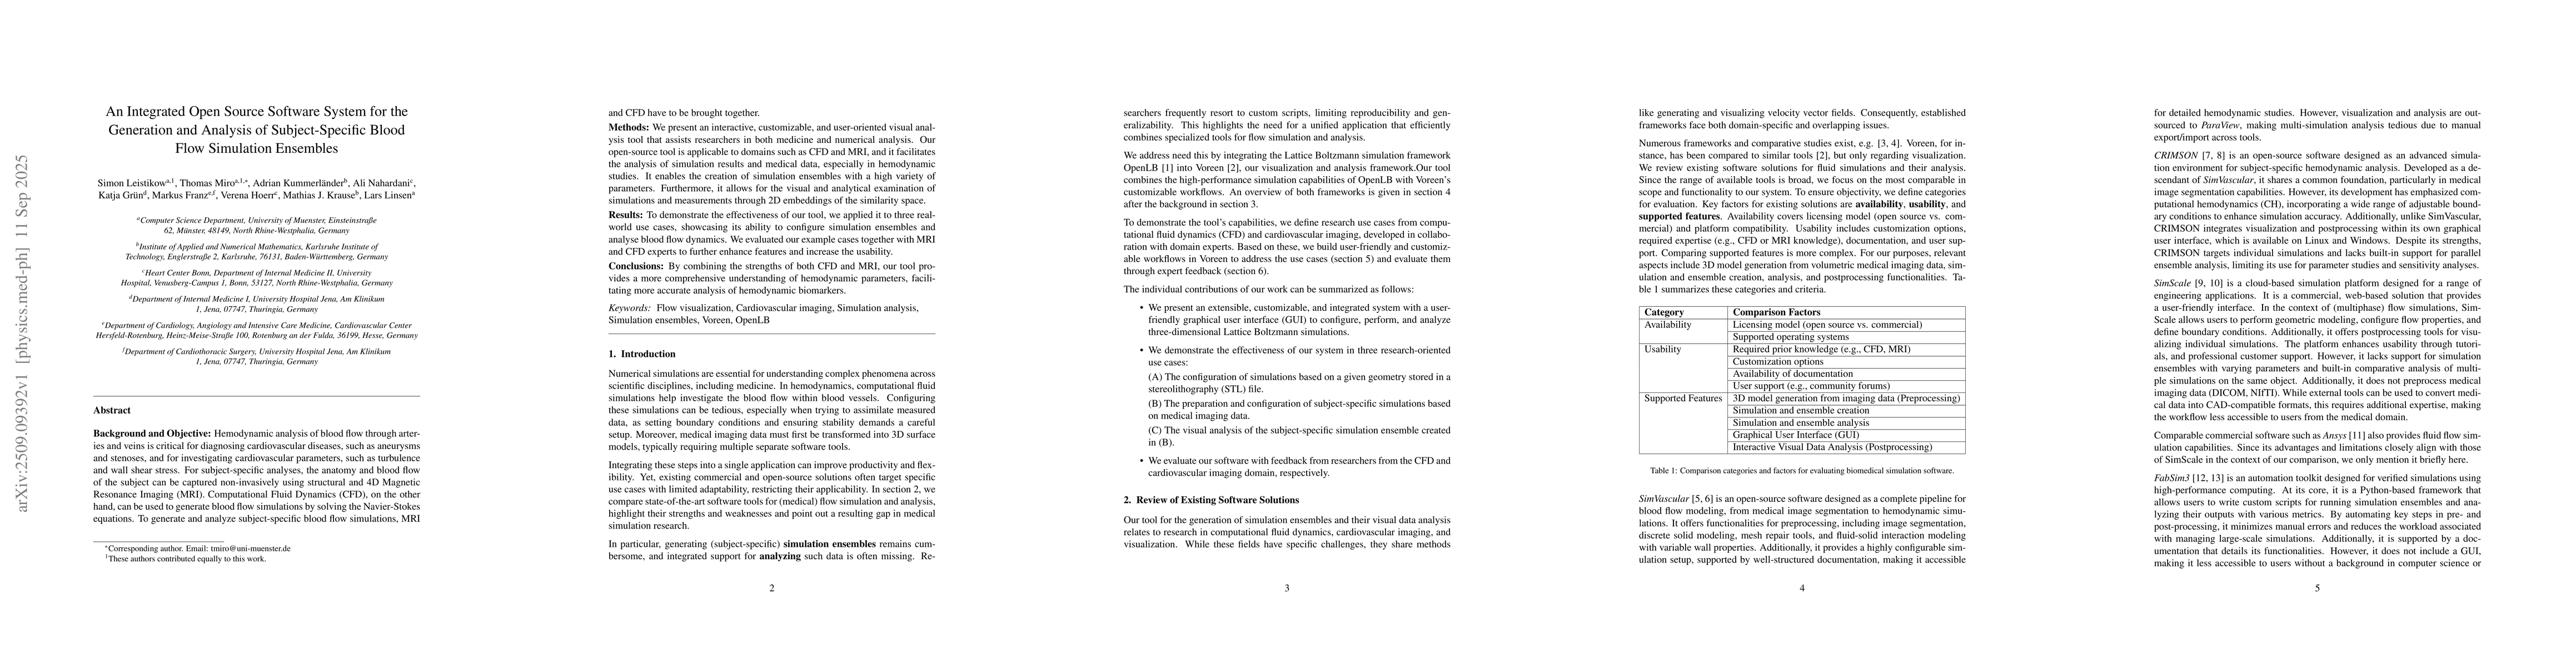
Background and Objective: Hemodynamic analysis of blood flow through arteries and veins is critical for diagnosing cardiovascular diseases, such as aneurysms and stenoses, and for investigating cardio...
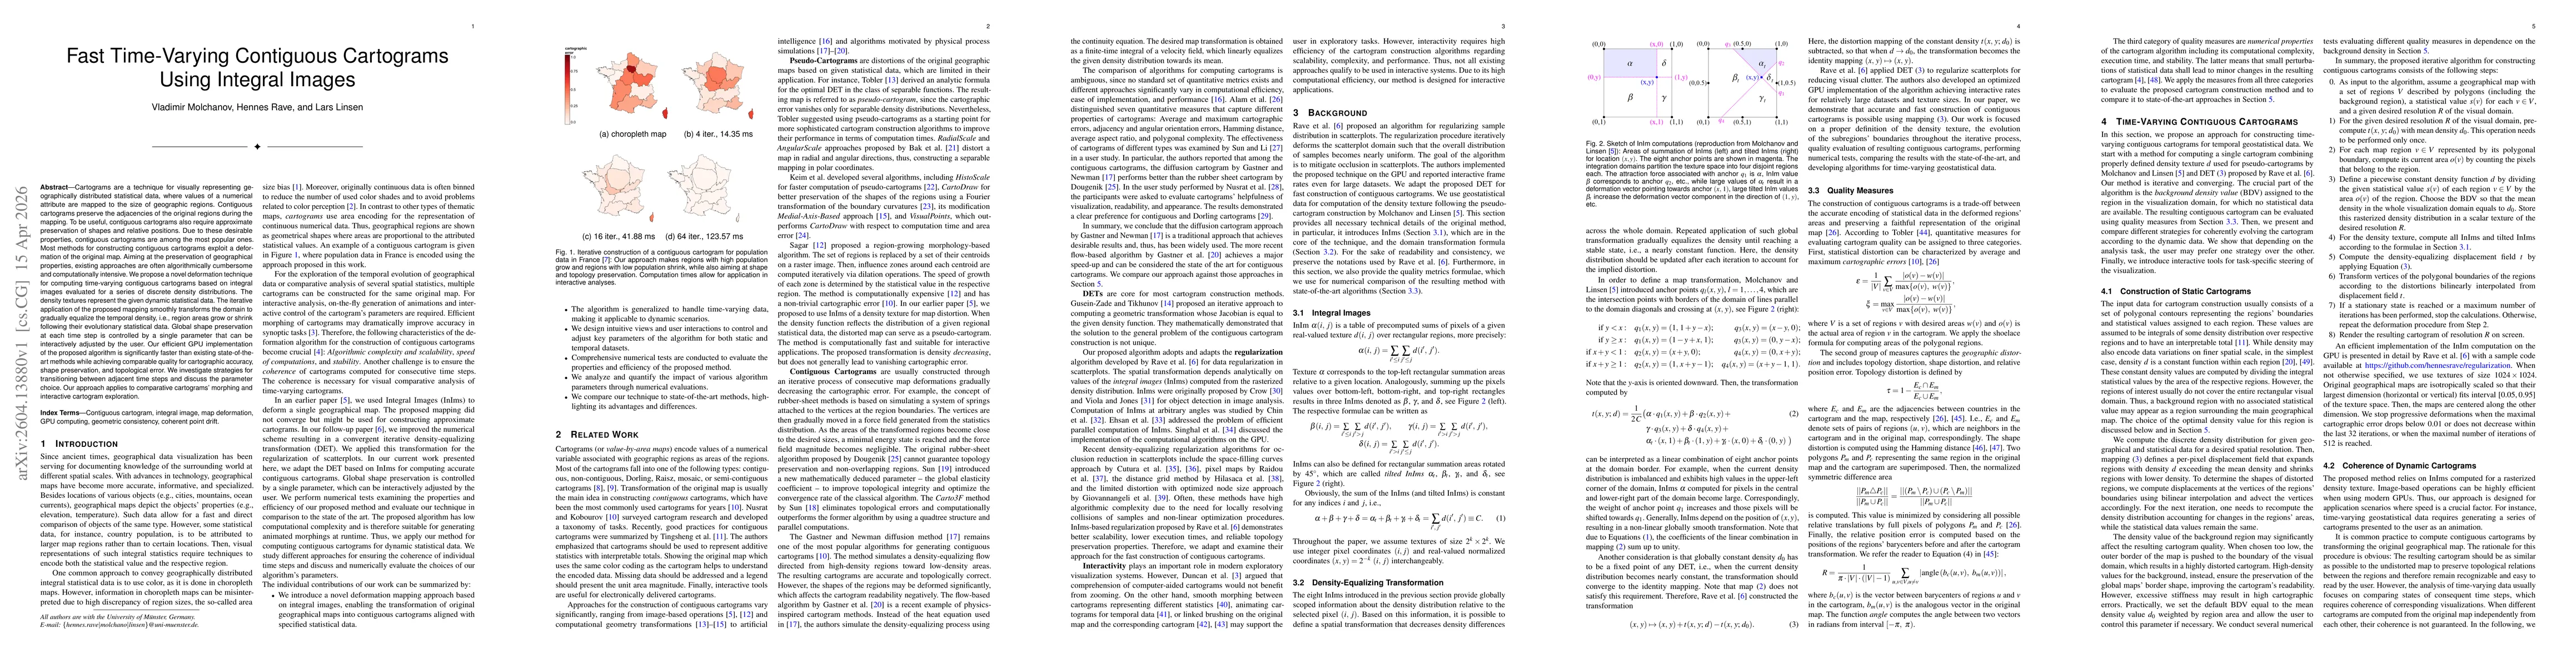
Cartograms are a technique for visually representing geographically distributed statistical data, where values of a numerical attribute are mapped to the size of geographic regions. Contiguous cartogr...
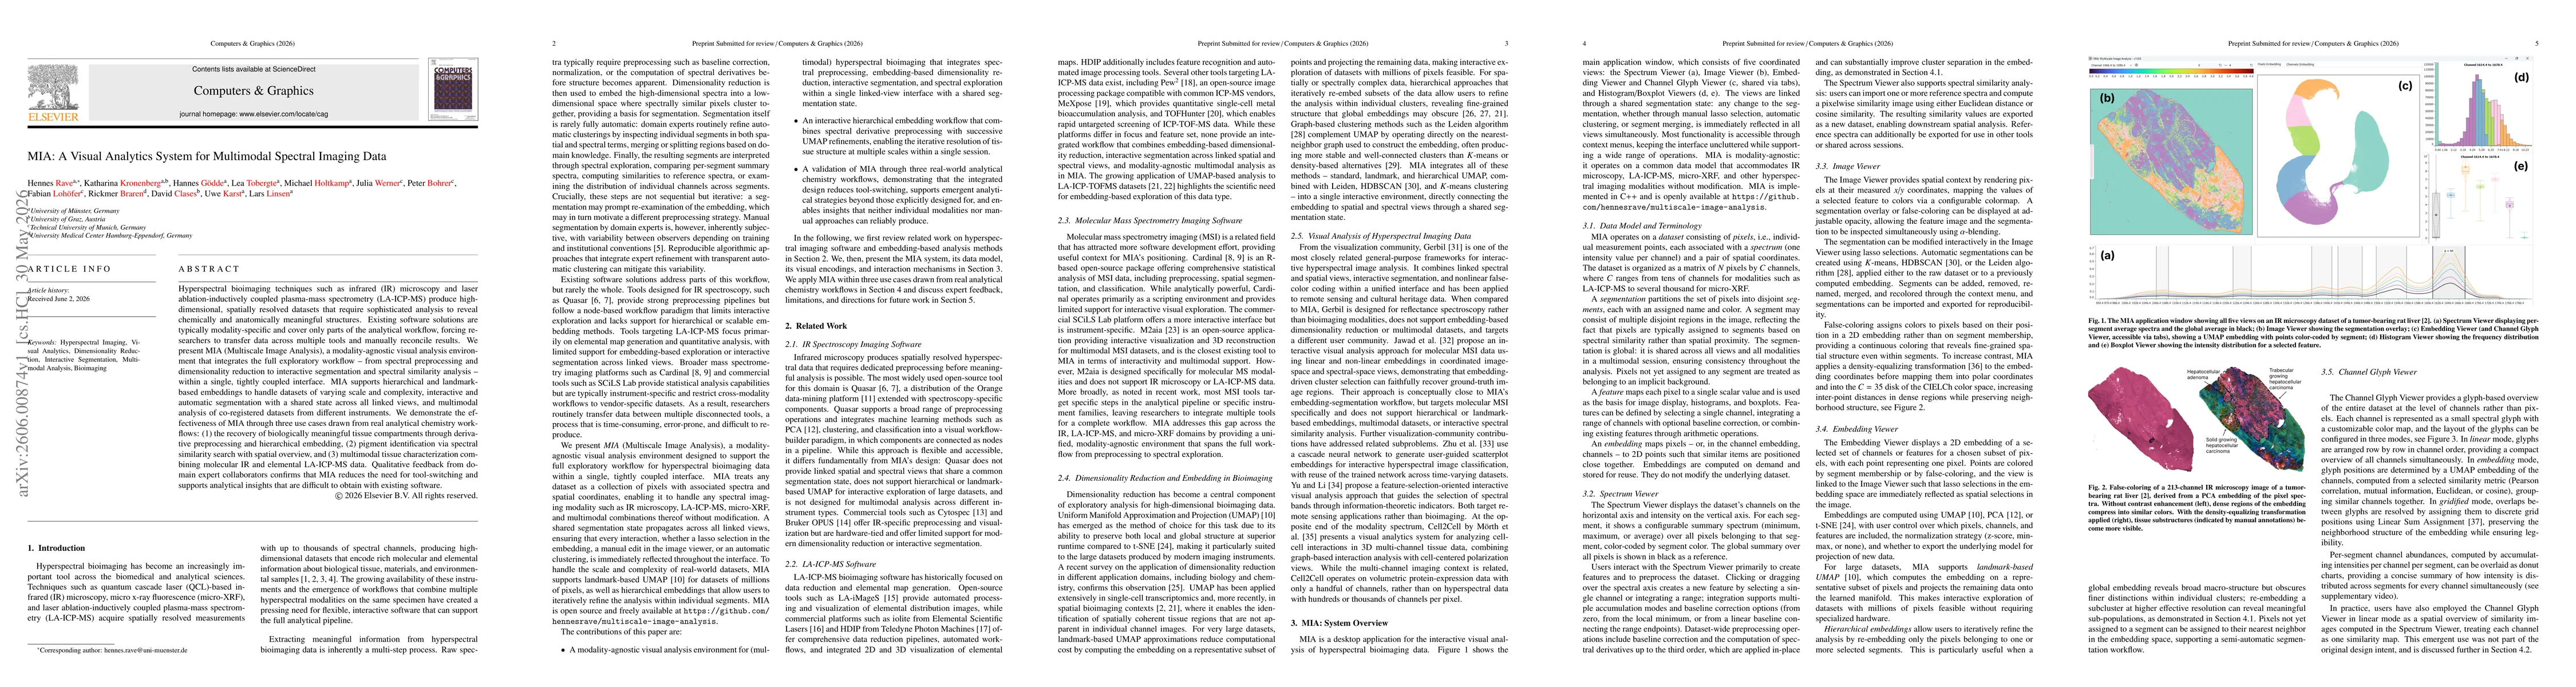
Hyperspectral bioimaging techniques such as infrared (IR) microscopy and laser ablation-inductively coupled plasma-mass spectrometry (LA-ICP-MS) produce high-dimensional, spatially resolved datasets t...