Publication
Metrics
AI Quick Summary
This paper proposes an interactive visual analytics system for analyzing spatial sensitivities in 3D simulations, enabling examination of localized parameter influences and their interplay across different regions. The method uses an overview visualization with linearized scalar fields and Horizon Graphs to address occlusion issues and present data effectively.
Paper Preview
Abstract
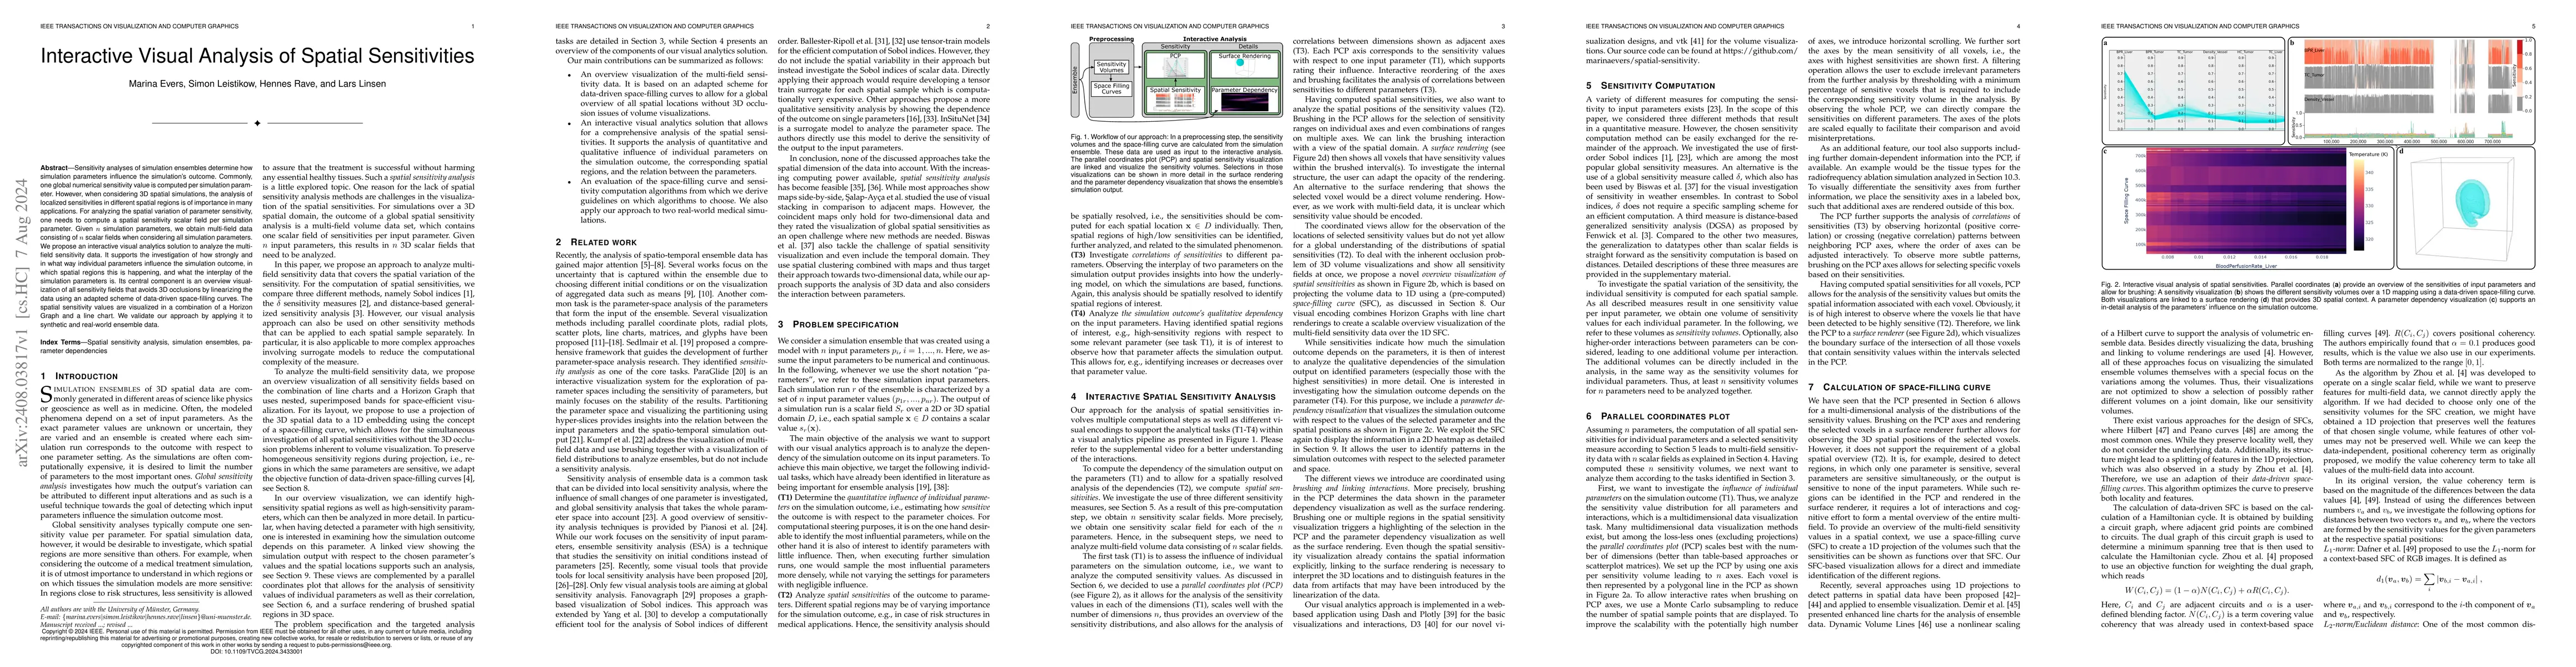
Sensitivity analyses of simulation ensembles determine how simulation parameters influence the simulation's outcome. Commonly, one global numerical sensitivity value is computed per simulation parameter. However, when considering 3D spatial simulations, the analysis of localized sensitivities in different spatial regions is of importance in many applications. For analyzing the spatial variation of parameter sensitivity, one needs to compute a spatial sensitivity scalar field per simulation parameter. Given $n$ simulation parameters, we obtain multi-field data consisting of $n$ scalar fields when considering all simulation parameters. We propose an interactive visual analytics solution to analyze the multi-field sensitivity data. It supports the investigation of how strongly and in what way individual parameters influence the simulation outcome, in which spatial regions this is happening, and what the interplay of the simulation parameters is. Its central component is an overview visualization of all sensitivity fields that avoids 3D occlusions by linearizing the data using an adapted scheme of data-driven space-filling curves. The spatial sensitivity values are visualized in a combination of a Horizon Graph and a line chart. We validate our approach by applying it to synthetic and real-world ensemble data.
AI Key Findings
Get AI-generated insights about this paper's methodology, results, significance, and more — seven facets brought into focus.
Impact
Paper Details
Authors
PDF Preview
Citation Network
Current paper (gray), citations (green), references (blue)
Display is limited for performance on very large graphs.
Discussion 0