Visual Analysis of Multiple Dynamic Sensitivities along Ascending Trajectories in the Atmosphere
Publication
Metrics
AI Quick Summary
This paper presents visual analytics solutions to interactively analyze the sensitivities of rain mass density to multiple model parameters along ascending warm conveyor belt trajectories in extratropical cyclones. The proposed visual interface allows atmospheric scientists to compare sensitivities across trajectories, assess spatio-temporal relationships, and analyze the temporal development of sensitivities, thereby aiding in the evaluation of microphysical parameterization uncertainties.
Paper Preview
Abstract
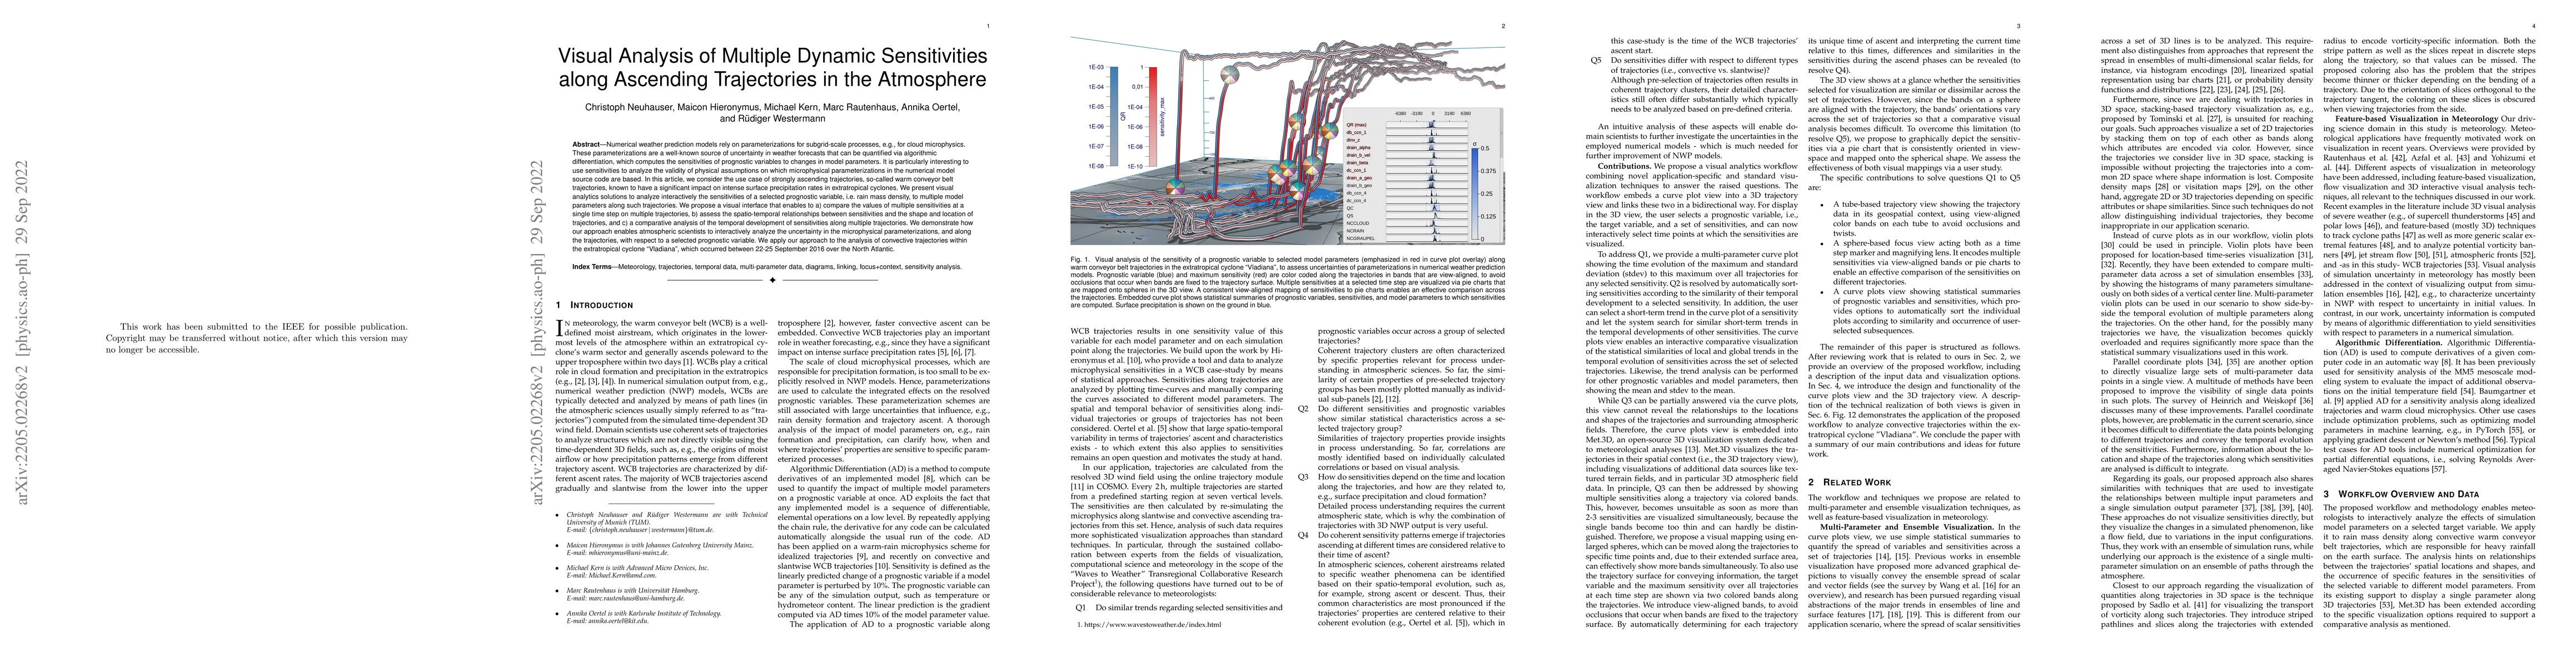
Numerical weather prediction models rely on parameterizations for subgrid-scale processes, e.g., for cloud microphysics. These parameterizations are a well-known source of uncertainty in weather forecasts that can be quantified via algorithmic differentiation, which computes the sensitivities of prognostic variables to changes in model parameters. It is particularly interesting to use sensitivities to analyze the validity of physical assumptions on which microphysical parameterizations in the numerical model source code are based. In this article, we consider the use case of strongly ascending trajectories, so-called warm conveyor belt trajectories, known to have a significant impact on intense surface precipitation rates in extratropical cyclones. We present visual analytics solutions to analyze interactively the sensitivities of a selected prognostic variable, i.e. rain mass density, to multiple model parameters along such trajectories. We propose a visual interface that enables to a) compare the values of multiple sensitivities at a single time step on multiple trajectories, b) assess the spatio-temporal relationships between sensitivities and the shape and location of trajectories, and c) a comparative analysis of the temporal development of sensitivities along multiple trajectories. We demonstrate how our approach enables atmospheric scientists to interactively analyze the uncertainty in the microphysical parameterizations, and along the trajectories, with respect to a selected prognostic variable. We apply our approach to the analysis of convective trajectories within the extratropical cyclone "Vladiana", which occurred between 22-25 September 2016 over the North Atlantic.
AI Key Findings
Get AI-generated insights about this paper's methodology, results, significance, and more — seven facets brought into focus.
Impact
Paper Details
Authors
PDF Preview
Key Terms
Citation Network
Current paper (gray), citations (green), references (blue)
Display is limited for performance on very large graphs.
Discussion 0