Publication
Metrics
AI Quick Summary
This study compares statistical properties of stock market data during bubble periods (inflation) and anti-bubble periods (deflation), finding distinct volatility distributions that suggest structural changes occurred in 1990.
Paper Preview
Abstract
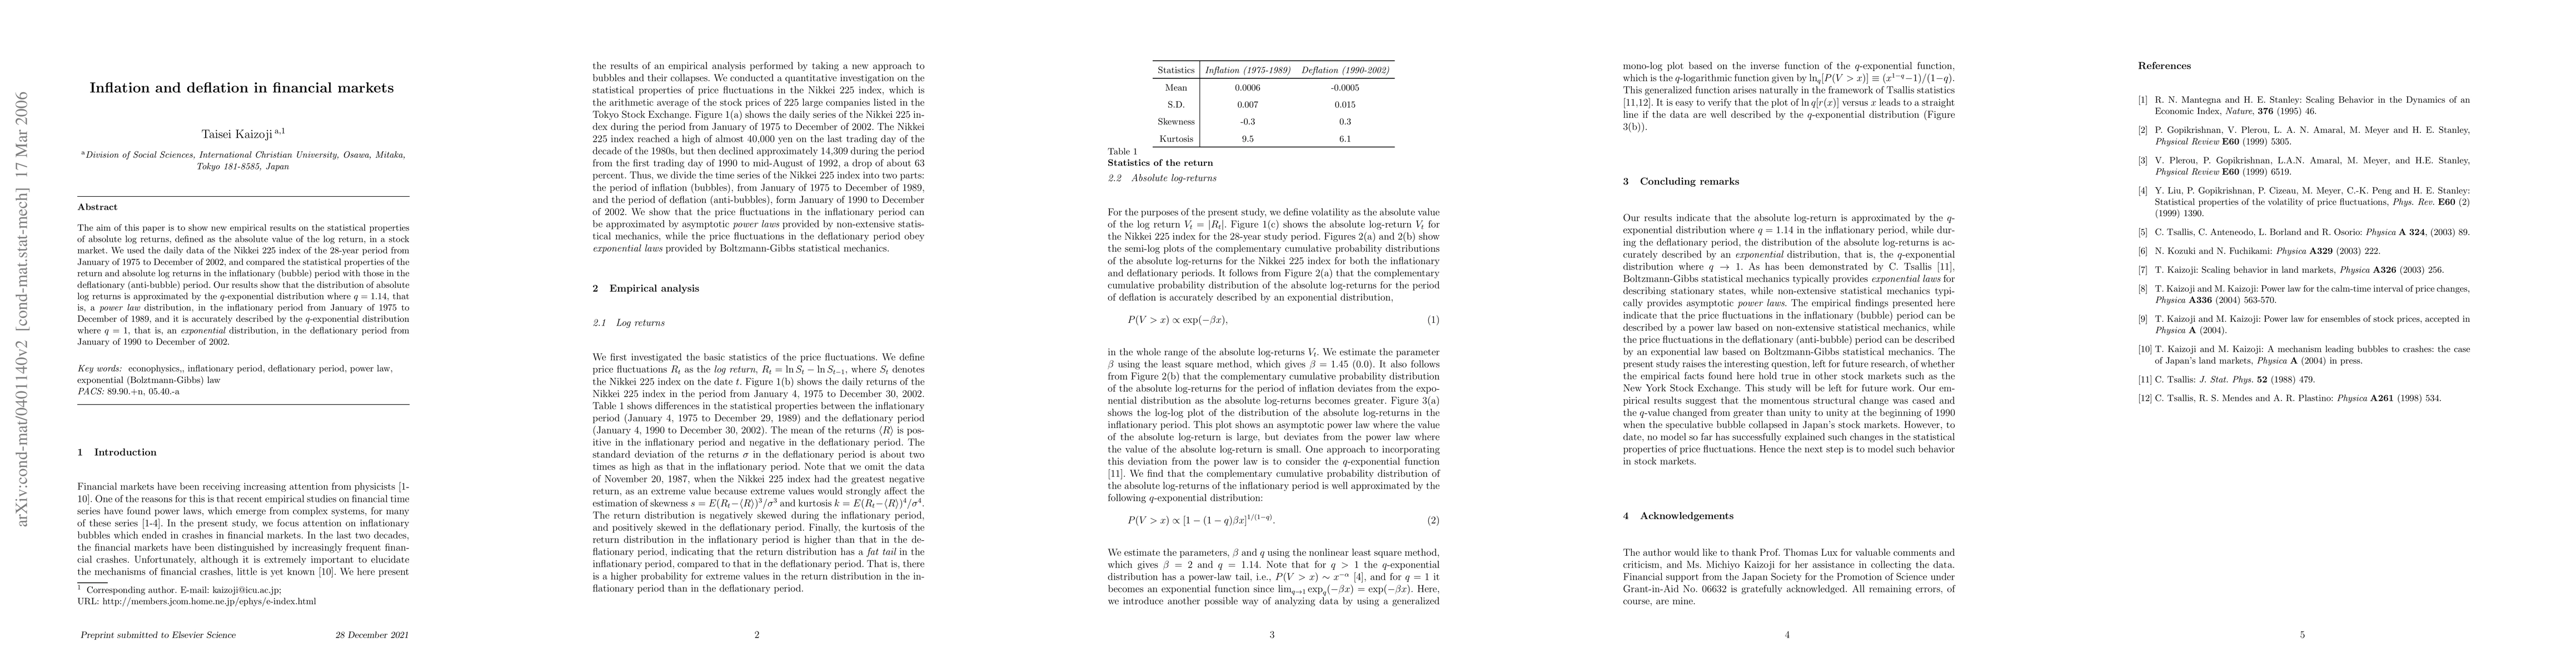
The aim of this paper is to compare statistical properties of a bubble period with those of the anti-bubble period in stock markets. We investigate the statistical properties of daily data for the Nikkei 225 index in the 28-year period from January 1975 to April 2003, corresponded to the periods of bubbles and anti-bubbles. We divide the time series into two parts, the period of {\it inflation (or bubbles)} from January 1975 to December 2002 and the period of {\it deflation (or anti-bubbles)} from January 1990 to December 2002. We find that the volatility in the inflationary period is approximated by the $q$-exponential distribution with $ q = 1.14 $ while the volatility distribution in the deflationary period is accurately described by an {\it exponential} distribution, that is, the $q$-exponential distribution with $ q \to 1 $. Our empirical findings suggest that the momentous structural changes have occurred at the beginning of 1990 when the speculative bubble was collapsed in the Japan's stock markets. Keywords: econophysics, inflationary period, deflationary period, power law, exponential (Bolztmann-Gibbs) law; PACS 89.90.+n; 05.40.-a;
AI Key Findings
Get AI-generated insights about this paper's methodology, results, significance, and more — seven facets brought into focus.
Impact
Paper Details
PDF Preview
Citation Network
Current paper (gray), citations (green), references (blue)
Display is limited for performance on very large graphs.
Discussion 0