Infogen: Generating Complex Statistical Infographics from Documents
Publication
Metrics
Paper Preview
Abstract
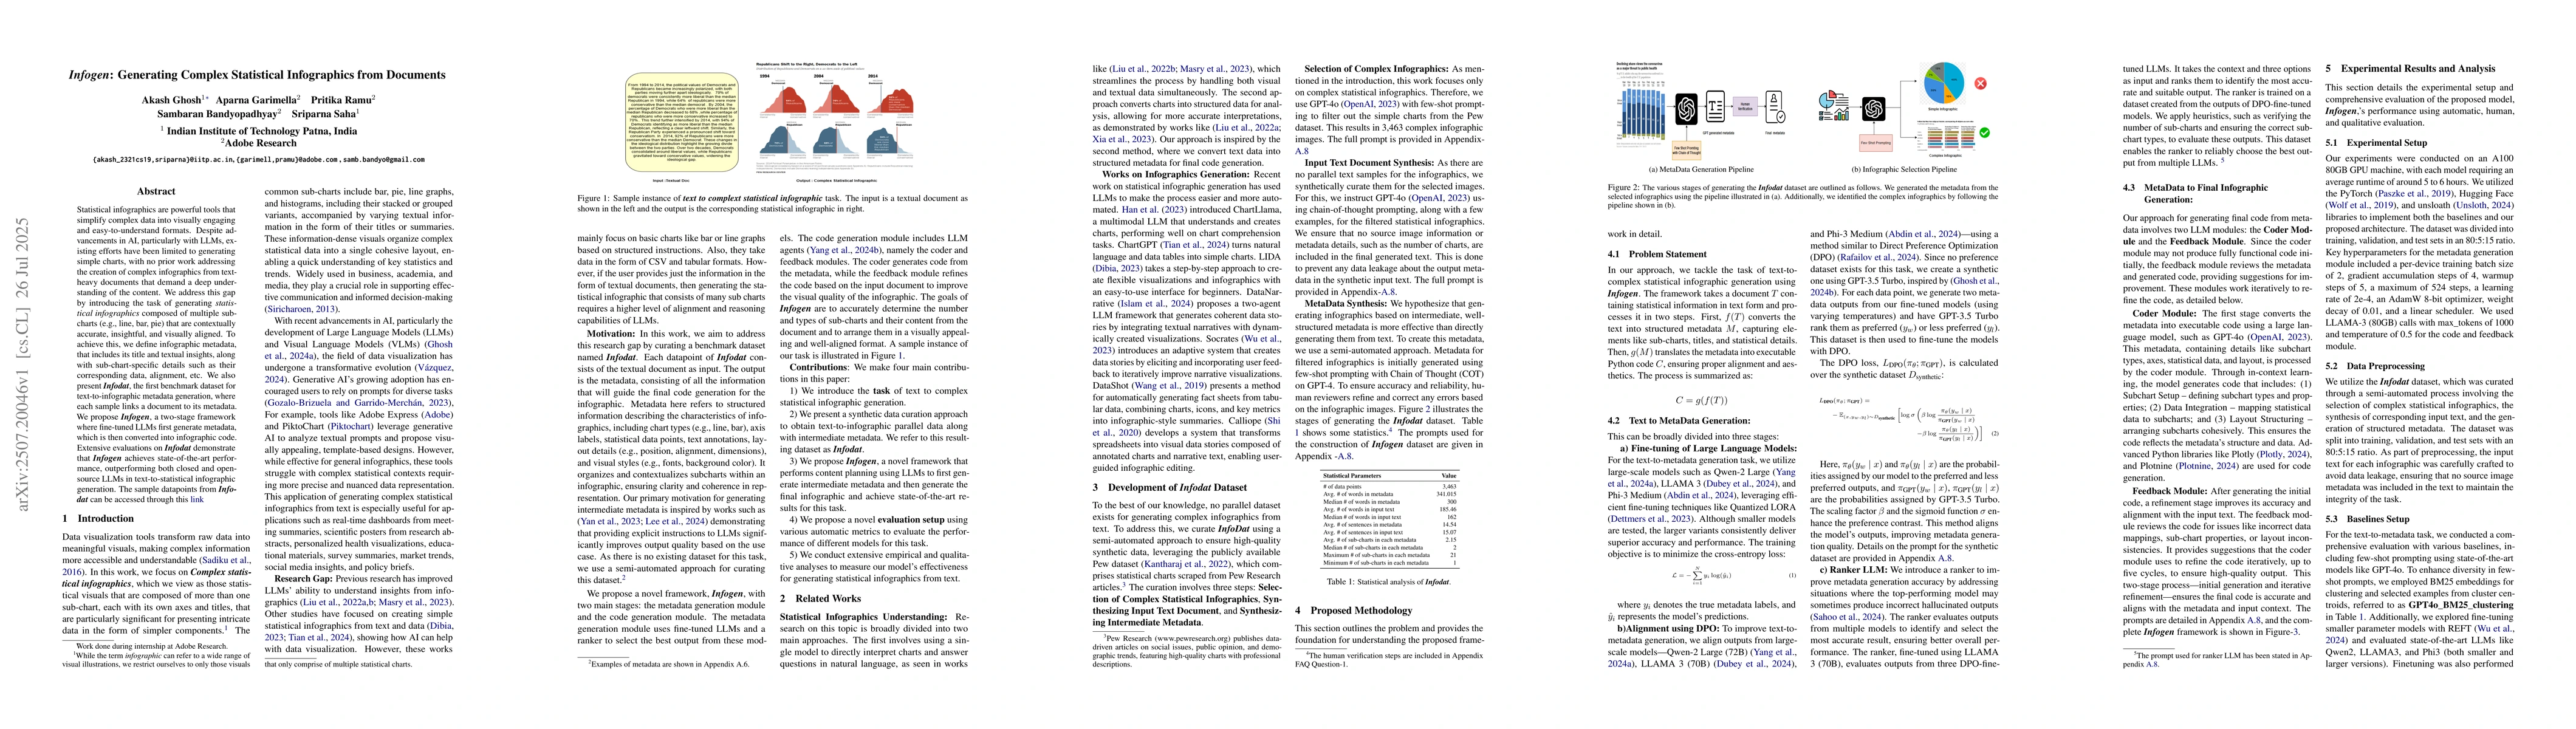
Statistical infographics are powerful tools that simplify complex data into visually engaging and easy-to-understand formats. Despite advancements in AI, particularly with LLMs, existing efforts have been limited to generating simple charts, with no prior work addressing the creation of complex infographics from text-heavy documents that demand a deep understanding of the content. We address this gap by introducing the task of generating statistical infographics composed of multiple sub-charts (e.g., line, bar, pie) that are contextually accurate, insightful, and visually aligned. To achieve this, we define infographic metadata that includes its title and textual insights, along with sub-chart-specific details such as their corresponding data and alignment. We also present Infodat, the first benchmark dataset for text-to-infographic metadata generation, where each sample links a document to its metadata. We propose Infogen, a two-stage framework where fine-tuned LLMs first generate metadata, which is then converted into infographic code. Extensive evaluations on Infodat demonstrate that Infogen achieves state-of-the-art performance, outperforming both closed and open-source LLMs in text-to-statistical infographic generation.
AI Key Findings
Get AI-generated insights about this paper's methodology, results, significance, and more — seven facets brought into focus.
Impact
Paper Details
Authors
PDF Preview
Citation Network
Current paper (gray), citations (green), references (blue)
Display is limited for performance on very large graphs.
Discussion 0